Science News
 Share
Share
 Blog
Blog
 Cite
Cite
 Print
Print
 Bookmark
 Email
Some Antarctic Ice Is Forming from Bottom
Email
Some Antarctic Ice Is Forming from Bottom
ScienceDaily (Mar. 4, 2011) — Scientists working in the remotest part of Antarctica have discovered that liquid water locked deep under the continent's coat of ice regularly thaws and refreezes to the bottom, creating as much as half the thickness of the ice in places, and actively modifying its structure. The finding, which turns common perceptions of glacial formation upside down, could reshape scientists' understanding of how the ice sheet expands and moves, and how it might react to warming climate, they say.
See Also:
Earth & Climate
Reference
The study appears in this week's early online edition of the journal
Science; it is part of a six-nation study of the invisible Gamburtsev Mountains, which lie buried under as much as two miles of ice.
Ice sheets are well known to grow from the top as snow falls and builds up annual layers over thousands of years, but scientists until recently have known little about the processes going on far below. In 2006, researchers in the current study showed that lakes of liquid water underlie widespread parts of Antarctica. In 2008-2009, they mounted an expedition using geophysical instruments to create 3-D images of the Gamburtsevs, a range larger than the European Alps. The expedition also made detailed images of the overlying ice, and subglacial water.
"We usually think of ice sheets like cakes--one layer at a time added from the top. This is like someone injected a layer of frosting at the bottom--a really thick layer," said Robin Bell, a geophysicist at Columbia University's Lamont-Doherty Earth Observatory and a project co-leader. "Water has always been known to be important to ice sheet dynamics, but mostly as a lubricant. As ice sheets change, we want to predict how they will change. Our results show that models must include water beneath." The Antarctic ice sheet holds enough fresh water to raise ocean levels 200 feet; if even a small part of it were to melt into the ocean, it could put major coastal cities under water.
The scientists found that refrozen ice makes up 24% of the ice sheet base around Dome A, a 13,800-foot-high plateau that forms the high point of the East Antarctic ice sheet, at 3.8 million square miles roughly the size of the continental United States. In places, slightly more than half the ice thickness appears to have originated from the bottom, not the top. Here, rates of refreezing are greater than surface accumulation rates. The researchers suggest that such refreezing has been going on since East Antarctica became encased in a large ice sheet some 32 million years ago. They may never know for sure: the ice is always moving from the deep interior toward the coast, so ice formed millions of years ago, and the evidence it would carry, is long gone.
Deeply buried ice may melt because overlying layers insulate the base, hemming in heat created there by friction, or radiating naturally from underlying rock. When the ice melts, refreezing may take place in multiple ways, the researchers say. If it collects along mountain ridges and heads of valleys, where the ice is thinner, low temperatures penetrating from the surface may refreeze it. In other cases, water gets squeezed up valley walls, and changes pressure rapidly. In the depths, water remains liquid even when it is below the normal freezing point, due to pressure exerted on it. But once moved up to an area of less pressure, such supercooled water can freeze almost instantly. Images produced by the researchers show that the refreezing deforms the ice sheet upward.
"When we first saw these structures in the field, we thought they looked like beehives and were worried they were an error in the data," Bell said. "As they were seen on many lines, it became clear that they were real. We did not think that water moving through ancient river valleys beneath more than one mile of ice would change the basic structure of the ice sheet."
Because the ice is in motion, understanding how it forms and deforms at the base is critical to understanding how the sheets will move, particularly in response to climate changes, researchers say. "It's an extremely important observation for us because this is potentially lifting the very oldest ice off the bed," said Jeff Severinghaus, a geologist at Scripps Institution of Oceanography in San Diego who was not involved in the study. He said it could either mean older ice is better preserved -- or, it could "make it harder to interpret the record, if it's shuffled like a deck of cards."
From November 2008 to January 2009, the researchers did fieldwork around a California-size part of Dome A. Using aircraft equipped with ice penetrating radars, laser ranging systems, gravity meters and magnetometers, they flew low-altitude transects back and forth over the ice to draw 3-D images of what lay beneath. The aim was to understand how the mountains arose, and to study the connections between the peaks, the ice sheet, and subglacial lakes. They were also hunting for likely spots where future coring may retrieve the oldest ice. The work took place near the Southern Pole of Inaccessibility, the point farthest away from any ocean, and much harder to reach than the South Pole itself. They lived in isolated field camps, enduring high winds and temperatures ranging down to minus 40 degrees C.
"Understanding these interactions is critical for the search for the oldest ice and also to better comprehend subglacial environments and ice sheet dynamics," said Fausto Ferraccioli, a scientist with the British Antarctic Survey who also helped lead the project. "Incorporating these processes into models will enable more accurate predictions of ice sheet response to global warming and its impact on future sea-level rise."
The researchers now will look into how the refreezing process acts along the margins of ice sheets, where the most visible change is occurring in Antarctica. Based on their data, a Chinese team also hopes to drill deep into Dome A in the next two or three years to remove cores that would trace long-ago climate shifts. They hope to find ice more than a million years old.
Other co-authors of the paper include Timothy T. Creyts, Indrani Das, Nicholas Frearson and Michael Wolovik, of Lamont-Doherty; Hugh Corr, Thomas Jordan and Kathryn Rose of the British Antarctic Survey; David Braaten of the Center for Remote Sensing of Ice Sheets at Kansas University; Detlef Damaske of Germany's Federal Institute for Geosciences and Resources; and Michael Studinger of the NASA Goddard Space Flight Center in Maryland.
The work was funded by the U.S. National Science Foundation and launched in conjunction with the International Polar Year, a 2007-2009 effort to study the poles by thousands of scientists from more than 60 nations. Support also came from the Natural Environment Research Council of Britain; the Australian Antarctic Division; and the Polar Research Institute of China.
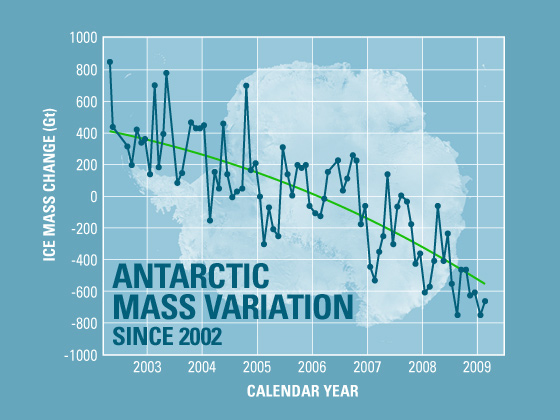
The East Antarctic ice sheet is growing you have to remember
July 30 2011,
Science magazine says that NASA scientists rechecking ice-monitoring data from eastern Antarctica say reports of a big melt from the continent have been exaggerated. Which means earlier graphs are meaningless.