Thanks, the intermediate points are interesting. But the average rate-of-change over the 7-mo period would still be calculated using the two endpoints, just as your amount-of-change calc would. Do appreciate the data though and I like that the two groups are about equal in size. We'll eventually lose the control group as more get vaxed and that's concerning.
The two endpoints are only applicable if all other conditions remain static, and if the starting point was "we vaccinate 50% of the population in 1 day, and then let it ride, and everything else remains static". But that's the not the case.
You had a combination of factors (like the immergence of Delta, and states relaxing policies) happening in the middle of that time window.
There's a difference between a one-time factor and a factor that has an exponential effect. The immergence of Delta, and policy relaxation aren't exponential factors.
As an analogy to clarify the mathematical pattern, think of it as your boss assigning you an additional task at work.
Let's say, under normal conditions, your work day was 8 hours. Your boss calls you on Monday night and assigns you an additional task starting Tuesday that takes an hour, so your work day goes from 8 to 9 hours.
So from Monday to Tuesday, your work day increased by 12 percent...
So, does that mean that the rest of your work week is going to look like:
Monday: 8 hours
Tuesday: 9 hours
Wednesday: 10.1 hours
Thursday: 11.2 hours
Friday: 12.5 hours
??
Or is it going to be:
Monday: 8 hours
Tuesday: 9 hours
Wednesday: 9 hours
Thursday: 9 hours
Friday: 9 hours
??
The correct answer of course, is the latter, because that additional one hour task (let's call it the "Delta Assignment") was introduced into your workload (case load), but that factor doesn't have an exponential impact on your schedule. That additional 1-hour task will still take you 1 hour on Wednesday, just like it did on Tuesday.
That's basically what we're seeing with this.
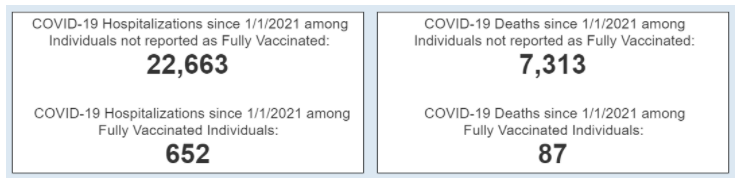
Pre-delta, we were seeing an increase of 20-30 breakthrough deaths a month
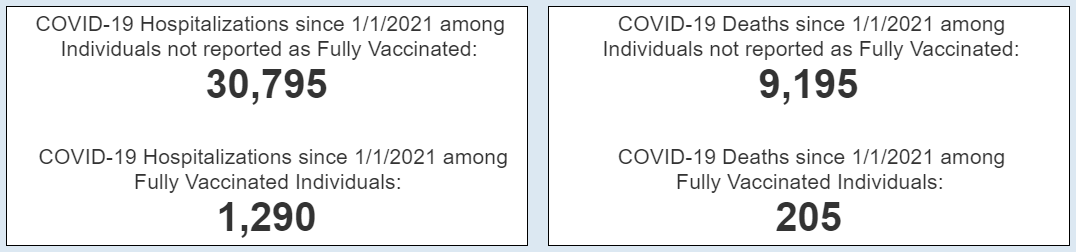
Amid-delta, we were seeing an increase of 100-150 breakthrough deaths a month
If it followed your progression pattern:
Since it went from 97 (which is what it was in the last breakthrough update before delta) to 205, that's a doubling.
Which means that if it was following your pattern
Mid-October would've gone up by 410 breakthrough deaths (it only went up 160)
Mid-November would've gone up 820 (it only went up 120)
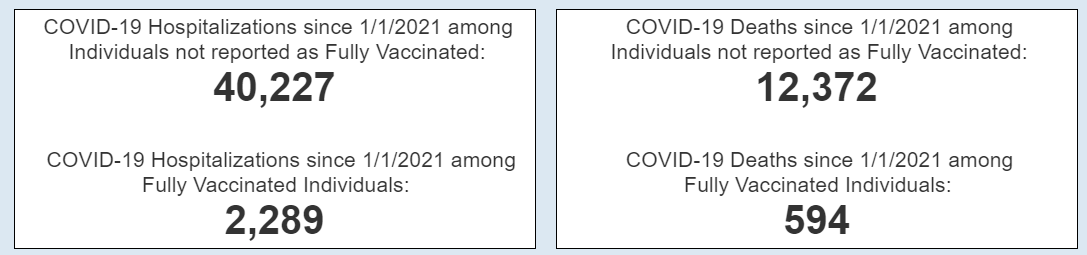
Mid December would go up by 1640 (it's only up 104 at the moment, with only a few days left till we hit mid-Dec)
So among the vaccinated vs unvaccinated over the past 3 months, the deaths went up by
160/120/104
vs.
977/481/1,719
The former is looking a lot better than the latter.