Hmm .. I'm not sure I see how that might answer my original question, though(?)
(This is probably just my problem here .. not yours
")
)
Can you perhaps illustrate with an example, (inputs then outputs), using a couple of data points, where the outputs of the function are assigned blackness?
First of all some basics.
The complex number z is of the form z = x + yi where x and y are real numbers and i = √-1 is an imaginary number.
The modulus of z or |z| = √(x² + y²)
The equation x² + y² = |z|² is simply the equation of a circle of radius |z|.
One can also have functions of complex variables of the form f(z).
One particular function is f(z) = z² +c where z and c are complex numbers.
Lets suppose we input z = 0 and let c vary then the output is f(0) = c.
f(0) now becomes our new variable which is inputted back into the function which is now of the form f(f(0)).
This is known as an iteration which can be repeated by now making f(f(0)) the new input and the function takes the form f(f(f(0)).
The process can be repeated to any number of iterations.
At each iteration the modulus of |f(0)|, |f(f(0))|, |f(f(f(0))|…… can be calculated.
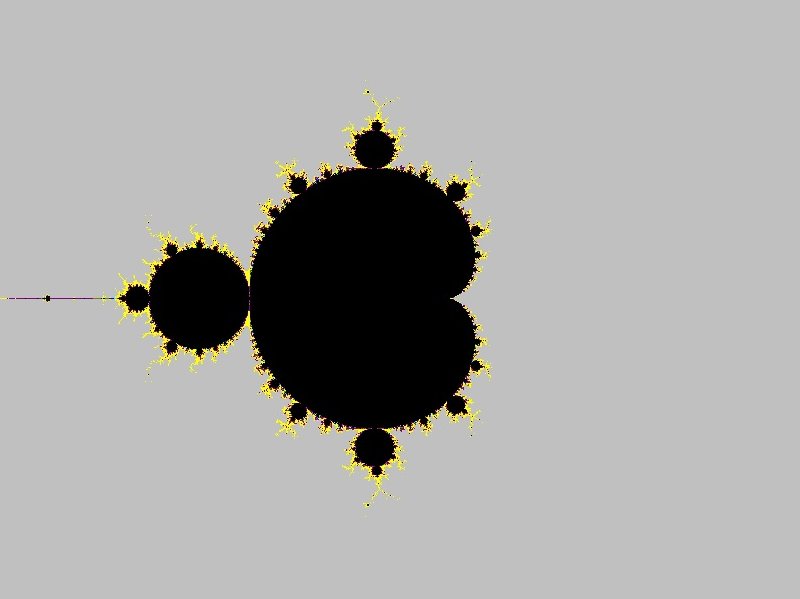
The condition for a Mandelbrot set is that if we perform an infinite number of iterations the modulus for each term |f(0)|, |f(f(0))|, |f(f(f(0))|…… is always less than or equal to 2 which depends on c.
If the condition is met then c is an element in the Mandelbrot set.
It’s obviously not possible to iterate the function an infinite number of times in a computer program.
I set the limit to 400 iterations and am fairly confident if the modulus of the 400th iteration is still less than or equal to 2 it will remain that way.
Here are some examples.
For c = 0 + 1i, |f(0)| = 1, |f(f(0))| = 1.4142136, |f(f(f(0))| = 1, f(f(f(f(0)))) = 1.4142136.
The modulus alternates between 1 and 1.4142136 hence the point c is assigned a black value when plotted.
For c = 0.5 + 0.5i the successive moduli for each iterative term is 0.70710678, 1.11803399, 1.52069063, 1.70591801, 3.54935426, 13.3049962, 177.531916, 31517.1012, 9.9332767e8, 9.8669986e17, 9.73576613e35, 9.47851422e71, 8.98422318e143, overflow error.
After the 4th iteration the condition is no longer met and c is plotted with a light gray value.
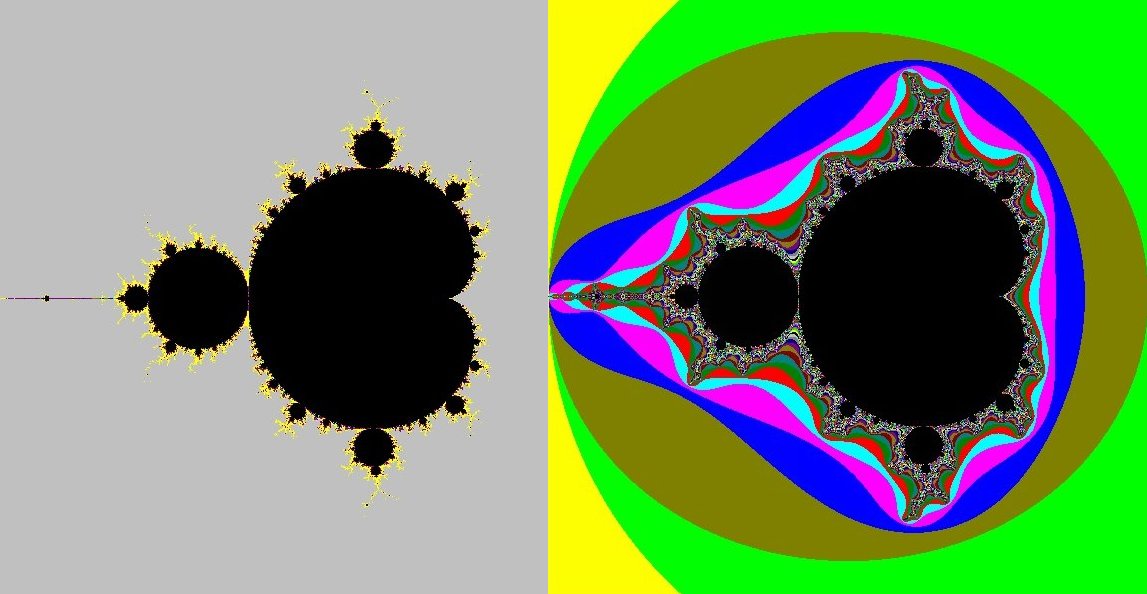
The yellow values in the plot of the Mandelbrot set occurs where the value exceeds 2 but in the interval of 20-50 iterations.