You are using an out of date browser. It may not display this or other websites correctly.
You should upgrade or use an alternative browser.
You should upgrade or use an alternative browser.
The day of reckoning. What will replace the standard solar theory?
- Thread starter Michael
- Start date
N
Nabobalis
Guest
Again, no one has any idea on how this image was created. Let alone tried to recreate it with more recent data.
Until that happens, there is nothing to talk about.
Until that happens, there is nothing to talk about.
Upvote
0
Datasets | Science On a Sphere
I think a little background on wavelengths and temperature estimates is in order:
A reference to what the NASA scientists are actually saying is in order. They are saying that it is millions of degrees. Period. Are you saying that the SDO satellite is faulty, that it is really not measuring millions of degrees K? Are you saying that everyone working with the SDO are all wrong, or printing fake data in the captions of images?
When I counted pixels and did the math, I was absolutely *astounded* to find that my numbers were within 12KM of the 4800 figure, and the margin of error wasn't as bad as I feared. That simply blew my mind.
Just like steam coming from the middle of a guys head.
Upvote
0
What an odd approach. It's almost as if this is personal for you. Just seems ... weird.
Well, solar physics is my passion, and the falsification of mainstream solar theory is probably a once in a lifetime event. I do find it to be an 'exciting' time in solar physics, and it's something I've personally been interested in, and I've studied my entire adult life.
I suppose I do feel a sense of personal vindication after all the personal attacks that I've put up with over the past 7 or 8 years. It's nice to see the mainstream squirm for awhile.
")
Upvote
0
Again, no one has any idea on how this image was created.
That's not entirely true. I can tell you that the 304A, 171A and 193A wavelengths from the AIA image set were used to create that overlay image.
Let alone tried to recreate it with more recent data.
Until that happens, there is nothing to talk about.
Oh sure there's plenty to talk about. It's not just a matter of recreating this one image that is important, it's a matter of putting together the entire set of AIA wavelengths into one cohesive picture of the solar atmosphere that matters. That's why it's so important to overlay magnetogram images on top of 1600A and 1700A images, along with 171A and other iron ion wavelengths to see the whole picture. It's so very nice of NASA to create powerful new tools like Helioviever to allow anyone and everyone to create their own overlay images.
Various 1600A images along the limb will sometimes show the loops as they rise up and through the photosphere and loop back into the photosphere near sunspots. The same images show the mass movement from the various flares blowing material up and through the surface of the photosphere. The hot bright points on the surface of the photosphere in the 1600A images align themselves with the large coronal loops, and the hot spots in the magnetogram images. All the wavelengths and various tools of SDO matter, not just a few of them.
All the images have to agree, and fit together properly, not just a few wavelengths, or just one or two images.
SDO is a quantum leap forward in terms of the tools and the cadence it offers us. No single solar image tells the *entire* picture, but that first light image told us a lot. It falsified standard solar theory on day one, and it confirmed a prediction that I had made 5 years prior. On day one of operation, SDO *finally* confirmed a prediction that I had waited about 5 years to see.
I knew it would take the HMI data to put the real heat on the mainstream, and now that has taken place as well. SDO is a game changer in terms of solar physics research.
You don't have to take my word for any of this either. The tools that are required to verify these claims is available online for free.
Upvote
0
A reference to what the NASA scientists are actually saying is in order. They are saying that it is millions of degrees. Period.
No, that's not what they said. They said that there were *two* wavelengths that were important and *two* temperature ranges under discussion. The 304A image relates to HeII ions, in plasma measured in the tens of thousands of degrees. They also mentioned the 195A wavelength, and it's relationship to plasma that is in the *million* degree range. These two wavelengths are *orders of magnitude* different from one another in terms of what they show us. Period!
The 304A wavelength is sensitive to HeII ions that are present in the chromosphere inside of plasma radiating in the tens of thousands of degree range. Such images show us the entire chromosphere.
The 195A wavelength is a horse of a different color. It's sensitive to heavily ionized iron radiating around a million degrees+. Like all iron ion wavelengths, it's sensitive to million degree plasma inside of electromagnetic flux ropes. The light source of all such iron ion images are the flux ropes. These are two *entirely different wavelengths* that show us two very different things!
No, I'm saying it works perfectly, and it's sensitive to a *range* of various types of plasma, at various temperatures, including the photosphere, the chromosphere and the "transition region".Are you saying that the SDO satellite is faulty, that it is really not measuring millions of degrees K?
Nope. The captions are correct and the images are stunning. The only thing I'm saying is that you seem to not understand the importance of the 304A wavelength as it relates to solar physics research. It's not the 'same as' the iron ion wavelengths in terms of what it shows us.Are you saying that everyone working with the SDO are all wrong, or printing fake data in the captions of images?
You keep avoiding the key aspects of *solar physics* by interjecting ridiculous statements into the conversation.Just like steam coming from the middle of a guys head.
Until you accept that not every wavelengths shows us million degree plasma, there isn't much to talk about. The fundamental difference between your iron ion image and the first light image is that you didn't include the 304A overlay of the chromosphere, and your image used different color assignments for the million degree flux rope images.
Since you left out the 304A chromosphere, there isn't enough information in your image to demonstrate any geometric relationships at the limb. Have you even figured out that the color of the "transition region" is arbitrary yet?
Upvote
0
TheBear
NON-WOKED
Well, solar physics is my passion, and the falsification of mainstream solar theory is probably a once in a lifetime event. I do find it to be an 'exciting' time in solar physics, and it's something I've personally been interested in, and I've studied my entire adult life.
Have you studied this at university or on your own?
I suppose I do feel a sense of personal vindication after all the personal attacks that I've put up with over the past 7 or 8 years. It's nice to see the mainstream squirm for awhile.
Personal attacks over what? The content is benign regarding anything personal.
I can't figure out why you're so personally vested in this. Have your own publications been rejected by editors? Do you have money riding on this? What's the deal?
Upvote
0
Twice in the past two years, SDO has falsified the standard solar model. The fallout began immediately as SDO's first light images demonstrated that the magnetic ropes actually originate and are visible about 4800KM *beneath* the chromosphere/photosphere boundary, an observation that is "impossible" in standard theory.
http://www.thesurfaceofthesun.com/images/sdo/447006main_fulldiskmulticolor-orig_new1_full.jpg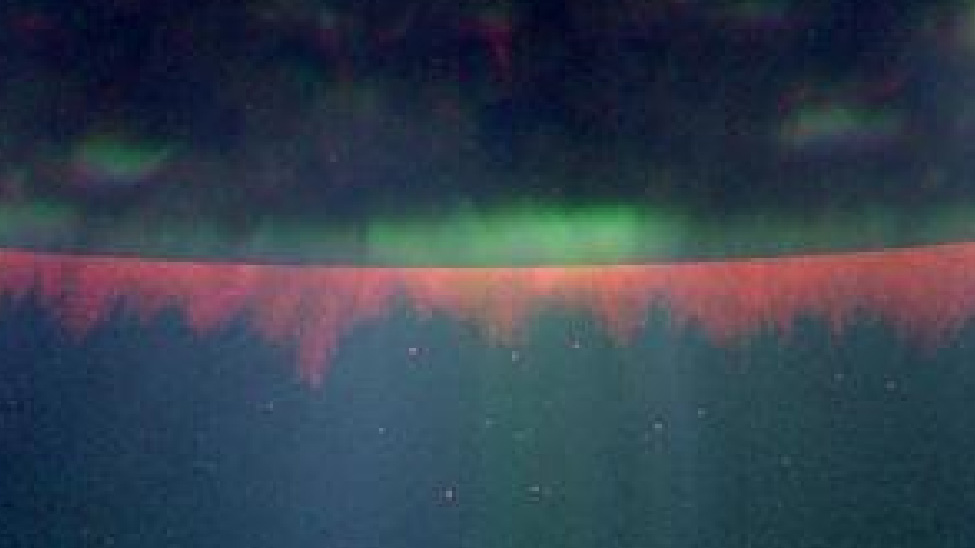
More damning yet, the HMI equipment on SDO has recently been used to falsify yet another *key* and highly important prediction of standard solar theory, specifically the speed of convection inside the sun. It turns out that convection occurs at only about 1 percent of predicted value. Two key aspects of standard solar theory are decimated by these discoveries. Without fast convection to stir things up, there's no way that Iron and Nickel will "float" and stay mixed into in a wispy thin hydrogen atmosphere and remain mixed together. Rather the heavier elements will surely sink with only 1 percent of predicted convection. The second major blow relates to the energy state of the atmosphere:
Weak solar convection approximately 100 times slower than scientists had previously projected | Watts Up With That?
Not only do these new findings by SDO take away the ability to explain the suspension of heavy elements in the atmosphere, these observations blow huge holes in the power source that the mainstream uses to explain solar flares and solar atmospheric activity. Since mainstream theory has now been falsified, what's next?
when I read post like these I'm dumbfounded at what an idiot I am, because I haven't a clue what your talking about.........which is why I'm not a big fan of jeopardy......."I'll take solar atmospheric activity for 100 Alex"
Upvote
0
K
kenvin
Guest
Well, solar physics is my passion, and the falsification of mainstream solar theory is probably a once in a lifetime event. I do find it to be an 'exciting' time in solar physics, and it's something I've personally been interested in, and I've studied my entire adult life.
I suppose I do feel a sense of personal vindication after all the personal attacks that I've put up with over the past 7 or 8 years. It's nice to see the mainstream squirm for awhile.
Where did you get your degree in physics?
Upvote
0
when I read post like these I'm dumbfounded at what an idiot I am, because I haven't a clue what your talking about.........which is why I'm not a big fan of jeopardy......."I'll take solar atmospheric activity for 100 Alex"
Solar physics definitely isn't for everyone.
I've been interested in solar physics for more than 20 years. At this point, my wife's eyes simply "glaze over" every time I talk about it.
Upvote
0
This site stays free and accessible to all because of donations from people like you.
Consider making a one-time or monthly donation. We appreciate your support!
- Dan Doughty and Team Christian Forums
Have you studied this at university or on your own?
Mostly I have studied it on my own. I was interested in programming in college (and as a career), but astronomy in general and solar physics in particular has been a life long hobby. I got hooked on astronomy by the Apollo moon landings, and I got hooked on solar physics when looking at Yohkoh x-ray images of the solar atmosphere.
I wasn't really referring to this thread or even this website so much as some of the astronomy oriented websites that I've visited over the past 8 years. I expected the ideas that I presented to be attacked, but the fixation on the individual was a bit "over the top" at times.Personal attacks over what? The content is benign regarding anything personal.
I've been "personally invested" in solar satellite image research for over 20 years since I started studying the Yohkoh images. It's more of a "personal passion" of mine than anything else. The same is true of astronomy. It's really just a life long passion that dates back the Apollo missions and moon landings, which set off a life long interest in astronomy.I can't figure out why you're so personally vested in this. Have your own publications been rejected by editors? Do you have money riding on this? What's the deal?
I have actually published a few papers on the topic, so there is no revenge oriented motivation aimed at any particular publication. Considering what a vocal critic of Lambda-CDM *and* standard solar theory I've been over the years, I'm pretty sure there's no Nobel Prize money in it for me.
It is very exciting however since the falsification of standard solar theory isn't something that I expected to see in my lifetime, certainly not when reviewing those first few Yohkoh images of the sun.
Last edited:
Upvote
0
when I read post like these I'm dumbfounded at what an idiot I am, because I haven't a clue what your talking about.........which is why I'm not a big fan of jeopardy......."I'll take solar atmospheric activity for 100 Alex"
In this case, the relevant Jeopardy question is "Why isn't the "transition region" (the base of the bright green horizon around the dark opaque disk of the sun) located in the orange 304A chromosphere as "predicted" by mainstream theory?"
That image was actually designed to "test" of the location of the transition region in relationship to the chromosphere in orange. According to mainstream theory, the bright green transition region is "supposed" to be located in the orange flaming 304A ring, near the outer edge of the chromosphere. Instead, the "transition region" is actually located about 4800KM *under* the orange chromosphere, as I predicted back in 2005.
Last edited:
Upvote
0
No, that's not what they said.
Yes, it is:
"A full-disk multiwavelength extreme ultraviolet image of the sun taken by SDO on March 30, 2010. False colors trace different gas temperatures. Reds are relatively cool (~60,000 K); blues and greens are hotter (> 1,000,000 K)."
First Light for the Solar Dynamics Observatory - NASA Science
That is the caption for the picture you keep showing. The lines you are pointing too are green. Blues and greens are hotter than 1 million C.
They said that there were *two* wavelengths that were important and *two* temperature ranges under discussion.
They said that blue and green are above 1 million degrees C. The green in your images is above 1 million degrees C.
Upvote
0
In this case, the relevant Jeopardy question is "Why isn't the "transition region" (the base of the bright green horizon around the dark opaque disk of the sun) located in the orange 304A chromosphere as "predicted" by mainstream theory?"
Because of processing artifacts, which has already been explained to you.
Where is the same same feature in this photo?
SDO - Solar Dynamics Observatory | SDO Gallery
I think it would be helpful if you zoomed in and actually made some marks at what you are looking at in the two pictures to make it clear.
That image was actually designed to "test" of the location of the transition region in relationship to the chromosphere in orange. According to mainstream theory, the bright green transition region is "supposed" to be located in the orange flaming 304A ring, near the outer edge of the chromosphere. Instead, the "transition region" is actually located about 4800KM *under* the orange chromosphere, as I predicted back in 2005.
How did you determine that the base of the green horizon is where you claim it is?
Upvote
0
This site stays free and accessible to all because of donations from people like you.
Consider making a one-time or monthly donation. We appreciate your support!
- Dan Doughty and Team Christian Forums
Of course not. Why would it? GM didn't contact anyone at NASA, nor quote anyone at NASA. He claimed the green color was related to a misalignment of the RGB images! Nobody at NASA told him that!
The image that LM cited doesn't have the 304A wavelength in it, and his iron line image shows the same bright horizon over an opaque disk that *every* iron ion wavelength includes. The color of the horizon is ultimately *irrelevant* since it is determined by the colors assigned to the iron lines.
Last edited:
Upvote
0
Yes, it is:
"A full-disk multiwavelength extreme ultraviolet image of the sun taken by SDO on March 30, 2010. False colors trace different gas temperatures. Reds are relatively cool (~60,000 K); blues and greens are hotter (> 1,000,000 K)."
First Light for the Solar Dynamics Observatory - NASA Science
That is the caption for the picture you keep showing. The lines you are pointing too are green. Blues and greens are hotter than 1 million C.
They said that blue and green are above 1 million degrees C. The green in your images is above 1 million degrees C.
Nobody doubts that! You simply never included a 304 reference image in your ion ion image, so it's a useless image in terms of comparing anything to the *chromosphere*!
Upvote
0
This site stays free and accessible to all because of donations from people like you.
Consider making a one-time or monthly donation. We appreciate your support!
- Dan Doughty and Team Christian Forums
Because of processing artifacts, which has already been explained to you.
Boloney. There are no ''processing artifacts" that are in any way relevant to the conversation or to the geometric relationships I'm describing. Who at NASA claimed otherwise?
The transition region where the limbe goes from opaque disk, to a bright horizon above the disk can be found in *every single* iron ion image ever made of the sun's limb from *every* spacecraft that has imaged the sun. The color of the horizon is arbitrary. Again, you did *NOT* pick an image that included any reference to the chromosophere, so there's nothing to compare it to.
I zoomed in and counted the pixels from the darkened limb to the base of the orange chromosphere from all around the disk and I averaged them.How did you determine that the base of the green horizon is where you claim it is?
Upvote
0
Similar threads
- Replies
- 0
- Views
- 119
- Replies
- 1
- Views
- 96
- Replies
- 5
- Views
- 128
- Replies
- 10
- Views
- 198