The day of reckoning. What will replace the standard solar theory?

Loudmouth

Contributor
Aug 26, 2003
51,417
6,141
Visit site
✟98,005.00
Faith
Agnostic
Every single Iron ion image shows a bright horizon sitting above a limb darkened disk along the horizon.

But it does not show the green line you have highlighted in your opening post. It is not there.

[FONT=&quot]
Your accusation of NASA "doctoring" the first light images is very offensive to me frankly.
[/FONT]

Then why don't you ask them which filters and processing they used to produce those photos. The one person who did ask found out that your green line is an artifact of processing.
 
Upvote 0

Michael

Contributor
Site Supporter
Feb 5, 2002
25,145
1,721
Mt. Shasta, California
Visit site
✟298,148.00
Faith
Christian
But it does not show the green line you have highlighted in your opening post. It is not there.

:doh:

It is there! The "green line" as you keep calling it is simply the "bright horizon" that exists around every "opaque disk" observed in all iron ion images of the sun. Without exception, they *all* show a 'bright horizon' sitting directly above an opaque disk where iron ion light is "blocked" at the horizon. The color of the bright horizon is directly related to the color assignment of the *image*! In other words, if the iron ion wavelength is assigned the color blue, the bright horizon will appear blue directly above the opaque disk of the sun.

Likewise if they assign the wavelength the color yellow, the horizon line will be yellow. The flux ropes emit all the light and the current is the ultimate 'light source' that drives the emissions process, and heats the plasma in the flux ropes to millions of degrees.

If we *combine* a couple of iron ion images, the 'light sources' are also combined in the image. If for instance we assigned the iron lines blue and red, the horizon would appear to be purple, since many of the flux ropes would appear to be purple in color. In the first light image, they simply combined two iron line images, probably 171A and 195A based on the temperature ranges they cite, and they assigned them the colors of blue and yellow. As a result, many of the flux ropes appear to be 'green' in the blended image.

If you understood even the *first thing* about any iron ion images of the sun, you'd already know all this, and I wouldn't have to explain to you that your image actually *does* show a bright (in this case blue) horizon, sitting directly above an opaque disk.

Unfortunately for you/us, it does not show that bright horizon/opaque disk seen in iron ion images in relationship to the chromosphere/photosphere boundary like the first light image shows the chromosphere without the photosphere.

Since you don't know the first thing about the iron ion images, the only thing that seems to matter to you is the *color* they happened to assign the iron ion images in the first light images, and you imagine that any deviation in color is a 'big deal'. It's not. The colors assigned to the iron ion wavelengths are an *arbitrary choice* in the final analysis!

Then why don't you ask them which filters and processing they used to produce those photos. The one person who did ask found out that your green line is an artifact of processing.
Nobody asked anyone at NASA anything about those specific images, or quoted anyone from NASA or named any names from NASA. You have provided no evidence whatsoever that the first light SDO images were 'doctored' in any way. Apparently everything you *think* you know comes from some anonymous guy's post on one website in cyberspace that names no names, and who makes *basic* errors with respect to solar satellite images. Please!

I've asked various individuals at NASA, Stanford and LMSAL *many* questions about all kinds of various images over the years. I've even taken time off work and attended a few meetings at LMSAL over topics related to solar physics and solar satellite imagery. Without exception, every single person I've met has been very nice to me, and they've taken the time to answer all my questions, even "basic" questions. They've been highly professional and courteous to me. I am quite frankly *greatly* offended that you would accuse NASA of 'doctoring' a highly important first light image without so much as a *shred* of support! Apparently your entire claim is based upon parroting some unknown guys post from some message board in cyberspace. How goofy is that? The guy in question never quoted *anyone* at NASA. He never named any names at NASA. He made *BASIC* mistakes about the image in terms of the *reason* that the bright horizon around the first light image happened to be green. Nobody I've met at NASA would even make such a bonehead claim in the first place. The color of the horizon (green) is not due to any 'artifact' caused by any misalignment of RGB overlays. It's directly related to the *color assignments* that were given to each of the two iron iron wavelengths shown in the image, in this case yellow and blue, leaving us with a 'green' horizon.

Holy Cow! Apparently you're entire *NASA faked the image* claim is based upon an unsupported allegation from an unknown individual on the internet on some message board! :doh:

Honestly, at this point you have about as much credibility as a guy claiming to have inside knowledge from someone at NASA that NASA doctored all the moon landing images. Apparently you base this scientific opinion based upon something you read on some random cyberspace website that was posted by an anonymous handle, and who never even named a source! Wow!
:doh:
 
Last edited:
Upvote 0

Michael

Contributor
Site Supporter
Feb 5, 2002
25,145
1,721
Mt. Shasta, California
Visit site
✟298,148.00
Faith
Christian
Because the Bible states over and over that the Earth is stationary and immovable, and that the sun revolves around it. But it doesn't say the Earth is flat.

Mathematicians' Alternate Model of the Universe Explains Away the Need For Dark Energy | Popular Science
http://creation.com/our-galaxy-is-the-centre-of-the-universe-quantized-redshifts-show

As SZ correctly explained, I assume that the Earth revolves around the sun and our sun revolves around the center of our galaxy.

FYI, it turns out that if you're willing to throw out the Copernican principle, it is actually possible to 'explain' the universe that we observe *without* the need for dark energy. IMO that would be a plus to a certain degree. However, I'm personally of the opinion that photon redshift that we observe and interpret as movement is actually caused by "tired light/plasma redshift", not due to the expansion of space, nor is it related to being in any special location.
 
Last edited:
Upvote 0

Loudmouth

Contributor
Aug 26, 2003
51,417
6,141
Visit site
✟98,005.00
Faith
Agnostic
:doh:

It is there! The "green line" as you keep calling it is simply the "bright horizon" that exists around every "opaque disk" observed in all iron ion images of the sun.

That is the chromosphere, and it is not the green line you are pointing to in the picture in the opening post. It isn't there. Go ahead, zoom in on the image. The lines never go into the supposed photosphere. They stop right at the surface.


In the first light image, they simply combined two iron line images, probably 171A and 195A based on the temperature ranges they cite, and they assigned them the colors of blue and yellow.

Citations please, from NASA scientists who produced the image. This is the same requirement you want from other people, so why don't you produce the same information.

You have provided no evidence whatsoever that the first light SDO images were 'doctored' in any way.

You have provided no evidence whatsoever of the process that was used to produce the image. Where is that evidence?

I've asked various individuals at NASA, Stanford and LMSAL *many* questions about all kinds of various images over the years. I've even taken time off work and attended a few meetings at LMSAL over topics related to solar physics and solar satellite imagery. Without exception, every single person I've met has been very nice to me, and they've taken the time to answer all my questions, even "basic" questions.

Then ask them about that image and show us exactly what they say.

Apparently your entire claim is based upon parroting some unknown guys post from some message board in cyberspace.

That describes 99% of your posts.

Holy Cow! Apparently you're entire *NASA faked the image* claim is based upon an unsupported allegation from an unknown individual on the internet on some message board! :doh:

It is supported by the lack of the green line in other pictures.
 
Upvote 0

Michael

Contributor
Site Supporter
Feb 5, 2002
25,145
1,721
Mt. Shasta, California
Visit site
✟298,148.00
Faith
Christian
That is the chromosphere,

No, it's not. The chromosphere is the orange band in the first light image, and it's 4800KM *above* where the limb darkening and limb brightening occur in the iron ion images!

and it is not the green line you are pointing to in the picture in the opening post. It isn't there. Go ahead, zoom in on the image.
When I zoom in at the limb, I see an opaque limb with a bright horizon over it, just like *every* iron ion image! There's nothing unique about your image vs. the first light image other than the colors assigned to the wavelengths!

The lines never go into the supposed photosphere. They stop right at the surface.
The limb darkened area in the iron images is absolutely, positively not the "photosphere". The photosphere is located a full 4800KM *above* that limb darkened location in the first light images! There is no "photosphere" in your image, and no chromosphere in your image and therefore there is no way to see where the bright blue horizon begins in relationship to either the chromosphere or the photosphere. You don't have enough information in your image to even make the claims you're making!

Citations please, from NASA scientists who produced the image. This is the same requirement you want from other people, so why don't you produce the same information.
Boloney. I don't have to tell you which NASA scientists produced or worked on various moon landing images. I'm not accusing them of doctoring any images so it's not my job. You're the one claiming they "doctored" the image, and you've provided *nothing* to support that claim.

You have provided no evidence whatsoever of the process that was used to produce the image. Where is that evidence?
I'm not making any claims about NASA, I'm just telling you how *all* solar satellite images are created. All iron line images of the sun show a limb darkened area at the limb, right below a 'bright horizon'. The color of the image is *arbitrary*! The color is irrelevant in terms of defining anything related to the geometric *relationships* in question.

Then ask them about that image and show us exactly what they say.
I don't have to. I know exactly how the image was put together, and I know exactly what it shows. I have no evidence whatsoever that NASA "doctored" the image, and I have not made any false claims about NASA as you have done. Your accusation that NASA "doctored" the image is reckless and offensive. If you have no evidence to support that claim, you owe NASA an apology.

It is supported by the lack of the green line in other pictures.
There is no lack of a bright horizon sitting above an opaque limb in your image. It's right there. It's bright blue everywhere but the poles, but the color is irrelevant. The color has nothing to do with the geometric relationships in question, and you have never shown that NASA "doctored" any images.
 
Upvote 0

Loudmouth

Contributor
Aug 26, 2003
51,417
6,141
Visit site
✟98,005.00
Faith
Agnostic
No, it's not. The chromosphere is the orange band in the first light image, and it's 4800KM *above* where the limb darkening and limb brightening occur in the iron ion images!

That is the same region that is just above the photosphere in this picture:

http://ia600505.us.archive.org/18/i...1-orig/447365main_f_211_193_171-orig_full.jpg

The orange band in the picture in the OP is a different color in the image above. It does not shine from 4800KM from witin the sun. It is above the surface of the photosphere.

The limb darkened area in the iron images is absolutely, positively not the "photosphere".

Yes, it is.

You don't have enough information in your image to even make the claims you're making!

Oh the irony.

Boloney. I don't have to tell you which NASA scientists produced or worked on various moon landing images. I'm not accusing them of doctoring any images so it's not my job. You're the one claiming they "doctored" the image, and you've provided *nothing* to support that claim.

Yes, I do have support:

JREF Forum - View Single Post - [Moderated] Iron sun with Aether batteries...

I don't have to. I know exactly how the image was put together, and I know exactly what it shows.

So you expect others to supply references that you never intend to supply yourself.
 
Upvote 0

Michael

Contributor
Site Supporter
Feb 5, 2002
25,145
1,721
Mt. Shasta, California
Visit site
✟298,148.00
Faith
Christian
That is the same region that is just above the photosphere in this picture:
http://ia600505.us.archive.org/18/i...1-orig/447365main_f_211_193_171-orig_full.jpg

There is no "photosphere" in that image. It's all iron lines in that image, each and every wavelength! You have no way to even measure anything in that image that is related to either the chromosphere or the photosphere. All you have is an image in the iron ion lines, specifically 211A, 193A and 171A. All that shows us is the flux ropes that are rising (and falling) through the solar atmosphere. Since there is no 304A overlay in your image, nor has the photosphere been cropped from it, there is no logical way to reference the base of the flux ropes in relationship to the chromosphere in your image. You absolutely do *not* have enough information in you iron ion image to make any claims about the photosphere or the chromosphere!

The orange band in the picture in the OP is a different color in the image above.
False. The chromosphere is not shown in the image above at all! The orange band of the chromosphere comes from the 304A wavelength. That's not one of the three bands that were selected in your image. Your image contains *all iron ion lines*. The 304A wavelength is not included in your image at all!

It does not shine from 4800KM from witin the sun. It is above the surface of the photosphere.
False. Only the first light image overlays the 304A wavelength and subtracts out the photosphere so we can observe the limb and observe such geometric relationships. The first light image show that the rounded inside edge of the photosphere/chromosphere boundary is a full 4800 KM *above* the opaque disk observed in the iron ion wavelengths.

:doh:

So let me get this straight...

Your scientific reason from claiming that NASA "doctored" one of the (if not the) most important first light image in solar physics history comes from some anonymous guy on the internet on some random website that never named any names at NASA, nor quoted anyone from NASA and who uses a pot leaf as his avatar?

You do not have any logical support for claiming that NASA doctored that image. You have no name from anyone at NASA. You have no actual 'quote' either. You have some random unknown individual sticking works in NASA's mouth, that's what you have.

Honestly, if that is the only reason you claimed NASA "doctored" such an important first light image, you're even worse than most moon landing hoaxers on the internet. :(

So you expect others to supply references that you never intend to supply yourself.
I never claimed that NASA doctored or faked any satellite images. I would never make such a claim in fact. I certainly wouldn't do such a absurd and reckless thing based upon the word of one unknown guy from one random website that claimed to speak to NASA yet never named any names or used any actual quotes, even if his avatar wasn't a pot plant. :)
 
Last edited:
Upvote 0

Loudmouth

Contributor
Aug 26, 2003
51,417
6,141
Visit site
✟98,005.00
Faith
Agnostic
There is no "photosphere" in that image.

Yeah, there is. It is the opaque surface under the chromosphere.

You have no way to even measure anything in that image that is related to either the chromosphere or the photosphere.

Yes, I do. The photosphere is the transition area between the outer part of the sun that emits light and the opaque interior. Only 4% of light makes it through the top 400KM of photosphere.

The Photosphere of the Sun

You do *not* have enough information in you iron ion image to make any claims about the photosphere or the chromosphere!

Look who's talking.


False. The chromosphere is not shown in the image above at all! The orange band of the chromosphere comes from the 304A wavelength. That's not one of the three bands that were selected in your image. Your image contains *all iron ion lines*. The 304A wavelength is not included in your image at all!

What is the temperature of the plasma you are pointing at? It is over 1 million degrees, is it not? That is the chromosphere.

False. Only the first light image overlays the 304A wavelength and subtracts out the photosphere so we can observe the limb and observe such geometric relationships. The first light image show that the rounded inside edge of the photosphere/chromosphere boundary is a full 4800 KM *above* the opaque disk observed in the iron ion wavelengths.

References please.

Your scientific reason from claiming that NASA "doctored" one of the (if not the) most important first light image in solar physics history comes from some anonymous guy on the internet on some random website that never named any names at NASA, nor quoted anyone from NASA and who uses a pot leaf as his avatar?

Pot, meet kettle.
 
Upvote 0

Michael

Contributor
Site Supporter
Feb 5, 2002
25,145
1,721
Mt. Shasta, California
Visit site
✟298,148.00
Faith
Christian
Yeah, there is. It is the opaque surface under the chromosphere.

That opaque surface sits 4800KM under the base of the chromosphere/photosphere boundary in the first light image, all around the entire limb as well. Your image doesn't contain the same wavelengths as the first light image. Didn't you notice that?

Yes, I do. The photosphere is the transition area between the outer part of the sun that emits light and the opaque interior. Only 4% of light makes it through the top 400KM of photosphere.
SDO has already falsified standard solar theory twice, first with the first light AIA images, and now with the HMI gear. The assumptions of your falsified model are irrelevant in a Birkeland cathode solar model. I could care less what your falsified model *claimed* about the sun. It's already been shown to be unreliable in it's "assumptions".

Look who's talking.
I'm not the one accusing NASA of doctoring important first light images.

What is the temperature of the plasma you are pointing at? It is over 1 million degrees, is it not? That is the chromosphere.
No, it's not. The chromosphere is only about 20,000 K, *far* to cold to be picked up in *any* of the wavelengths in your image.

References please.
Sure, right after you tell me who GM talked to at NASA and give me their exact quote.

Actually, why not:

1975ApJ...197L.133B Page L133

The 304A wavelength has been used to study the chromosphere for many decades, even as far back as 1975. Does your image include the 304A wavelength?

Pot, meet kettle.
I haven't accused NASA of doctoring any images, nor did I put any words in NASA's mouth without so much as providing an actual name or an actual quote. The last time that I checked my avatar wasn't designed to glorify drug use. I'm not the one that bases their entire argument about NASA doctoring images on the sole word of such an individual.
 
Last edited:
Upvote 0

Loudmouth

Contributor
Aug 26, 2003
51,417
6,141
Visit site
✟98,005.00
Faith
Agnostic
That opaque surface sits 4800KM under the base of the chromosphere/photosphere boundary in the first light image, all around the entire limb as well.

No, it doesn't. There is no light that comes from 4800KM from within the photosphere. It is nearly opaque just a few hundred KM down. Ask any of the NASA scientists who run the SDO.

Perhaps this picture will help you out:

http://sdo.gsfc.nasa.gov/gallery/gallery/assets/preview/Mag_combo.jpg

This is a composite picture. Here is the caption for the photo:

The images of this Sun (Dec. 7, 2011) taken at almost the same time are shown in various wavelengths in various temperatures and layers of the Sun. In addition, we superimposed an illustration of the Sun's magnetic field lines to the view. We start off looking at the 6,000 degrees C. photosphere that shows the various sunspots on the "surface" of the Sun. Then we transition into the region between the chromosphere and the corona, at about 1 million degrees C. where, in extreme UV light, the active regions appear lighter. We phase in a composite of three different wavelengths showing temperatures up to 2 million degrees C. To top it off, we overlay a science-based estimation of the complex magnetic field lines (partly made visible in the first UV image) extending from and connecting the active regions before going back to the sunspot image. Who says the Sun is boring?
The yellow portion of the picture on the left is the 6,000C photosphere. The portion you keep pointing is labelled by the SDO scientists as the 1 million degree C chromosphere and corona. Clearly, the photosphere is below what you are pointing to according to the SDO scientists.

Added by edit: here is the link to the whole page which also includes movies for you to watch:

http://sdo.gsfc.nasa.gov/gallery/main.php?v=item&id=118
 
Last edited:
Upvote 0
This site stays free and accessible to all because of donations from people like you.
Consider making a one-time or monthly donation. We appreciate your support!
- Dan Doughty and Team Christian Forums

Michael

Contributor
Site Supporter
Feb 5, 2002
25,145
1,721
Mt. Shasta, California
Visit site
✟298,148.00
Faith
Christian
No, it doesn't.

Yes, it does. I personally counted the pixels many many many times.

There is no light that comes from 4800KM from within the photosphere. It is nearly opaque just a few hundred KM down. Ask any of the NASA scientists who run the SDO.
I'm quite certain that prior to the launch of SDO, virtually everyone involved with SDO was quite confident in the standard solar model. That is definitely no longer the case as I pointed out in the opening post. Both the first light AIA images, *and* the HMI gear *both* blow standard solar theory claims *completely away*. Whatever model might survive the age of SDO, it will definitely *not* be the standard solar theory.

Perhaps this picture will help you out:

http://sdo.gsfc.nasa.gov/gallery/gallery/assets/preview/Mag_combo.jpg

This is a composite picture. Here is the caption for the photo:
The images of this Sun (Dec. 7, 2011) taken at almost the same time are shown in various wavelengths in various temperatures and layers of the Sun. In addition, we superimposed an illustration of the Sun's magnetic field lines to the view. We start off looking at the 6,000 degrees C. photosphere that shows the various sunspots on the "surface" of the Sun.​
That would be the bright yellow 4500A wavelength on the far left. The 4500A wavelength is not included in your iron ion composite image, so you have no way to reference the "photosphere" in relationship the the bases of the flux loops seen in the iron ion wavelengths in your image.

Then we transition into the region between the chromosphere and the corona, at about 1 million degrees C. where, in extreme UV light, the active regions appear lighter. We phase in a composite of three different wavelengths showing temperatures up to 2 million degrees C. To top it off, we overlay a science-based estimation of the complex magnetic field lines (partly made visible in the first UV image) extending from and connecting the active regions before going back to the sunspot image. Who says the Sun is boring?
Essentially every other wavelength in that composite image is an iron ion wavelength associated with the flux ropes, and the electrical current that sustains those million degree flux ropes at high temperatures for hours and sometimes days at a time.

From even *before* they put "TRACE" (Transition region coronal explorer) into space, they "assumed" the existence of a 'transition region' that they "predicted" would be located in the upper chromosphere/lower corona of the sun, where they "assumed" that somehow (magically apparently) temperatures soar from a few thousand, to a few million degree, in a very thin atmospheric layer about 1200KM or so *above* the surface of the photosphere.

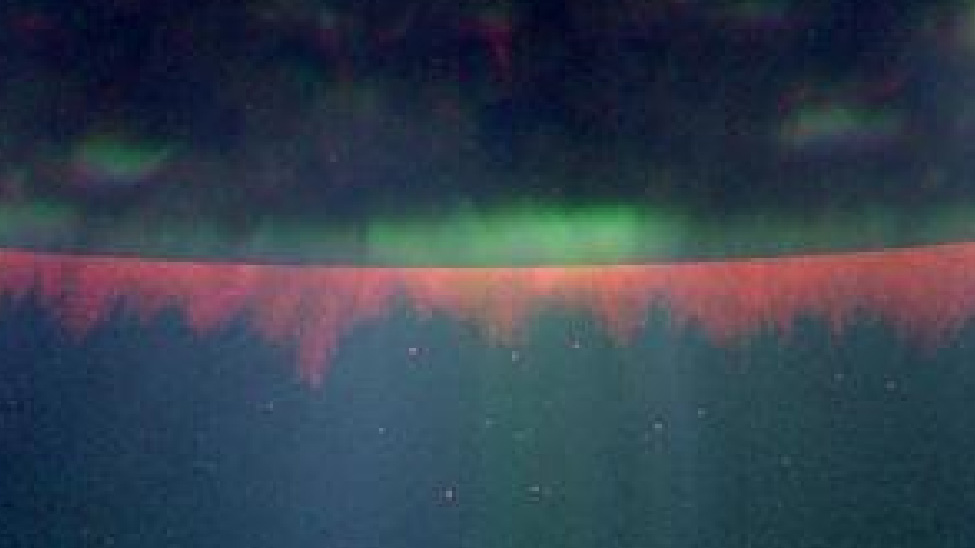
The engineers that designed and built SDO were absolutely intent on "testing" their "transition region" theory with SDO. The image we are discussing is the culmination of many hours of human effort to test exactly that theory. It overlays the iron ion 'transition region" images with the chromosphere/photosphere boundary, showing the geometric relationship between the top and bottom of the chromosphere and the base of the flux ropes from the 'transition region'. What they 'should have" seen in standard theory and what they actually observed are two entirely different animals.

In standard theory the "transition" region (the transition from opaque to bright horizon in the iron ion images), should have been locate somewhere *inside the orange 304A band* of the chromosphere. Instead it's located 4800KM *under* that orange band, and *under* what is 'supposed' to be an "opaque" surface to such wavelengths.

As predicted at BAUT in 2005 however, there is a 4800KM gap between the base of the orange chromosphere and the limb darkening feature seen in the iron ion wavelengths. That can *only* be explained with an electric sun, because only an electric sun could ionize the solar atmosphere to such a high energy state so as to allow these high energy wavelengths to travel such distances through the solar atmosphere.

The yellow portion of the picture on the left is the 6,000C photosphere. The portion you keep pointing is labelled by the SDO scientists as the 1 million degree C chromosphere and corona. Clearly, the photosphere is below what you are pointing to according to the SDO scientists.
I'm sure that what they *expected* to observe alright, just as they *expected* to observe fast convection. Unfortunately SDO didn't get the memo. :)

That first light image is probably *the* single most important image of the sun that humans have ever seen. Unless you have *real evidence* that NASA 'doctored' that image in any way, I strongly suggest you recant that claim, otherwise you come off sounding like nothing but moon landing hoaxer.

Had that limb darkening in the iron lines, and the bright horizon in the iron lines been located somewhere inside the orange band, or somewhere *above* it, I would have taken down my website in a day because I only have to answer to myself, to falsify what I believe in. Falsifying a model that virtually *everyone* believes in takes time. Even falsifying one model doesn't necessarily tell you which model is correct. A lot of soul searching is going on in solar physics these days. Heliosciesmology data has in fact crushed standard theory. Whatever theory does survive SDO scrutiny, it's definitely *not* standard solar theory.

As I have also explained, SDO allows us to overlay magnetogram images, 1600A images, and iron ion images in virtually real time, 24/7. Such overlay images are completely consistent with the first light images. They show that only the largest loops traverse the surface of the photosphere and leave bright footprints and magnetic alignments on it's surface. The flux ropes rip pieces of the Neon photosphere out into space along the path of travel and can be seen along the limbs coming up and through the photosphere in 1600A.

The array of new wavelengths and new features on SDO will take years to fully digest and appreciate, but all the images I've see thus far are completely consistent with a Birkeland cathode solar model, with a mass separated solar atmosphere.
 
Last edited:
Upvote 0

Loudmouth

Contributor
Aug 26, 2003
51,417
6,141
Visit site
✟98,005.00
Faith
Agnostic
Yes, it does. I personally counted the pixels many many many times.

You are not looking at a cross section. Counting pixels does not indicate depth.

I'm quite certain that prior to the launch of SDO, virtually everyone involved with SDO was quite confident in the standard solar model.

And they still are. None of them are publishing papers on solid iron surface. None.

That would be the bright yellow 4500A wavelength on the far left. The 4500A wavelength is not included in your iron ion composite image, so you have no way to reference the "photosphere" in relationship the the bases of the flux loops seen in the iron ion wavelengths in your image.

What is included in the second section is the filter that measures gas at millions of degrees. It even says so right there in the caption. It does not say 20,000K as you claim. You are pointing to the areas above the photosphere that measure in the millions of degrees. Why do you think they say that they TRANSITION into the areas with millions of degrees?
 
Upvote 0

Michael

Contributor
Site Supporter
Feb 5, 2002
25,145
1,721
Mt. Shasta, California
Visit site
✟298,148.00
Faith
Christian
You are not looking at a cross section. Counting pixels does not indicate depth.

I am looking at a cross section at the limb in terms of where the limb darkening/bright horizon in iron ion images is located in relationship to the chromosphere in 304A. *If* standard solar theory were correct, the transition region in iron ion wavelengths (opaque disk/bright horizon) would be located inside the orange chromosphere band along the limb. It's not. The iron ion transition region from opaque disk to bright horizon is located 4800KM under the base of the chromosphere.

And they still are. None of them are publishing papers on solid iron surface. None.
Even I haven't published any papers on a "solid" surface, just a "rigid" one. Baby steps.

FYI, whereas I did expect the solid surface aspects of my beliefs to be "doubted" by pretty much everyone at first, I was actually taken aback by the whole aversion to electricity in space that exists in astronomy today. It never crossed my mind that their would be such a strong aversion to "electric suns", even if there was an aversion to "solid suns". IMO the 'harder" hurdle is getting them to come out of the closet over the "electrical" aspects of solar physics. The rest can't happen until they at least do that much. :)

What is included in the second section is the filter that measures gas at millions of degrees. It even says so right there in the caption. It does not say 20,000K as you claim.
They are talking about the "transition region", an area *between* the chromosphere and corona in their now falsified theory. The HeII 304A wavelength is tuned to the actual *chromosphere*, whereas the iron ion wavelengths they are discussing in that image are all related to the 'transition region". Sheesh. I feel like I even have to explain *their* theory to you correctly!

You are pointing to the areas above the photosphere that measure in the millions of degrees. Why do you think they say that they TRANSITION into the areas with millions of degrees?
I think they *assumed* that long before they put up the very first satellites, and only SDO has had the ability to actually 'test" that belief. It failed miserably.

Had they been correct, the 'transition' from opaque disk to bright horizon would be inside the orange band, probably near the very top of that band. Only in an electrical solar model would it even be possible for iron ion light to traverse the solar atmosphere *under* the chromosphere.

Once solar physicists start talking about *electromagnetic* flux ropes, I'll start leaning on them heavily over the "solid surface" aspects of a Birkeland solar theory. Until the "plug it in" however, I can't properly explain the images to them. :)
 
Upvote 0

Loudmouth

Contributor
Aug 26, 2003
51,417
6,141
Visit site
✟98,005.00
Faith
Agnostic
I am looking at a cross section at the limb in terms of where the limb darkening/bright horizon in iron ion images is located in relationship to the chromosphere in 304A.

Yeah, just like I had a cross section of that guys head showing steam coming out from his brains.

They are talking about the "transition region", an area *between* the chromosphere and corona in their now falsified theory.

They are talking about millions of degrees, not 20,000.

"Then we transition into the region between the chromosphere and the corona, at about 1 million degrees C."

Had they been correct, the 'transition' from opaque disk to bright horizon would be inside the orange band,

It's on the surface above the photosphere.
 
Upvote 0

Michael

Contributor
Site Supporter
Feb 5, 2002
25,145
1,721
Mt. Shasta, California
Visit site
✟298,148.00
Faith
Christian
sd01.jpg


The most fundamental difference between your iron ion image and the first light image is the orange 304A band. That is the actual "chromosphere".

The "transition region" is observed in the iron ion wavelengths, not the chromosphere. The transition region in the ion lines is the area along the limb where the disk goes from opaque in the iron ion wavelengths, where the bright horizon of iron lines begin. If standard solar theory had been correct, that transition from opaque to green (or whatever color they pick) would have occurred inside the orange band, probably about 4 to 8 pixels above the base of the chromosphere. They falsified their own theory on day one. ;)

The "transition region" isn't located in the upper chromosphere as they predicted. It's located 4800KM *under* the base of the chromosphere as I predicted in 2005 based upon Kosovichev's work with sunspots and mass movements under suspots.
 
Upvote 0
This site stays free and accessible to all because of donations from people like you.
Consider making a one-time or monthly donation. We appreciate your support!
- Dan Doughty and Team Christian Forums

Michael

Contributor
Site Supporter
Feb 5, 2002
25,145
1,721
Mt. Shasta, California
Visit site
✟298,148.00
Faith
Christian
Yeah, just like I had a cross section of that guys head showing steam coming out from his brains.

Apparently only you could see that. ;)

They are talking about millions of degrees, not 20,000.
They are describing the "transition region', not the chromosphere.

"Then we transition into the region between the chromosphere and the corona, at about 1 million degrees C."
Ding ding! They are 'transiting" from one layer (chromosphere) to another (corona). All iron ion wavelengths relate to the 'transition region' in standard theory, whereas only the 304A wavelength related to HeII actually images the chromosphere. The whole reason the first light image *includes* the 304A wavelength (orange band) is so they can *measure* the distance between the base of the chromosphere (inner round edge) of the start of the 'transition region' in the iron lines!

It's on the surface above the photosphere.
No. The transition from opaque disk to bright horizon is *not* located in the orange chromosphere, or the *upper end* of the orange band. Rather it's located 4800KM *under* the orange band!

Until you figure out that the chromosphere is observed in 304A (orange band) and only the 'transition region' is observed in iron ion wavelengths, we really have nothing to talk about. It's *critical* that you comprehend and acknowledge the difference between the chromosphere in 304A, and the iron ion wavelength images. The iron ion wavelengths are related to *million* degree plasma, whereas 304A is related to plasma in the *tens of thousands* of degrees. The difference is like night and day. They are *orders of magnitude* different!

We can't talk about locating the "transition region" in relationship to the chromosphere if you refuse to recognize the difference between the two in *every* solar model!
 
Upvote 0

Loudmouth

Contributor
Aug 26, 2003
51,417
6,141
Visit site
✟98,005.00
Faith
Agnostic
The most fundamental difference between your iron ion image and the first light image is the orange 304A band. That is the actual "chromosphere".

The caption to that picture states:

"A full-disk multiwavelength extreme ultraviolet image of the sun taken by SDO on March 30, 2010. False colors trace different gas temperatures. Reds are relatively cool (~60,000 K); blues and greens are hotter (> 1,000,000 K)."
First Light for the Solar Dynamics Observatory - NASA Science

It is at millions of degrees Kelvin.

The "transition region" is observed in the iron ion wavelengths, not the chromosphere. The transition region in the ion lines is the area along the limb where the disk goes from opaque in the iron ion wavelengths, where the bright horizon of iron lines begin. If standard solar theory had been correct, that transition from opaque to green (or whatever color they pick) would have occurred inside the orange band, probably about 4 to 8 pixels above the base of the chromosphere. They falsified their own theory on day one. ;)

The "transition region" isn't located in the upper chromosphere as they predicted. It's located 4800KM *under* the base of the chromosphere as I predicted in 2005 based upon Kosovichev's work with sunspots and mass movements under suspots.

Earth to Michael. You are looking at a picture that was modified for a press release.
 
Upvote 0

Loudmouth

Contributor
Aug 26, 2003
51,417
6,141
Visit site
✟98,005.00
Faith
Agnostic
No. The transition from opaque disk to bright horizon is *not* located in the orange chromosphere, or the *upper end* of the orange band. Rather it's located 4800KM *under* the orange band!

How do you get the millions of degree corona below the photosphere, and still have that light go through the photosphere? You can't. Even NASA states that the green material you are looking at is millions of degrees.
 
Upvote 0

Michael

Contributor
Site Supporter
Feb 5, 2002
25,145
1,721
Mt. Shasta, California
Visit site
✟298,148.00
Faith
Christian
The caption to that picture states:

"A full-disk multiwavelength extreme ultraviolet image of the sun taken by SDO on March 30, 2010. False colors trace different gas temperatures. Reds are relatively cool (~60,000 K); blues and greens are hotter (> 1,000,000 K)."
First Light for the Solar Dynamics Observatory - NASA Science

It is at millions of degrees Kelvin.

Datasets | Science On a Sphere

I think a little background on wavelengths and temperature estimates is in order:

There are two STEREO/SDO datasets for Science On a Sphere, both from the extreme ultraviolet wavelength, which the human eye cannot see directly. In order to keep all of the various wavelengths straight, scientists color the different wavelengths. The 195A wavelength is arbitrarily colored green, while orange was selected for the 304A wavelength. The 195A wavelength is able to detect ionized iron at about 1.5 million degrees C and the 304 A wavelength detects ionized helium at about 60,000 degrees C.

The 60,000 degree number that NASA is citing is directly related to the 304A wavelength which is *absent* in your iron ion image of the sun, whereas it is visible in the first light SDO image.

Earth to Michael. You are looking at a picture that was modified for a press release.

It was in fact 'modified' in that it was assigned various colors, and processed to add the 304A helium chromosphere to the iron ion composite images. The whole point of doing that was to *test* the predictions of various models, most specifically the standard solar model. Had the standard model been correct, the "transition" region in iron ion images, where the opaque disk gives way to the bright horizon, would have been located inside, or at the top of the 304A orange ring.

In 2005, I used Kosovichev's sunspot research to "predict" that the "transition region" would be located about 4800KM under the bottom of the chromosphere.

When I counted pixels and did the math, I was absolutely *astounded* to find that my numbers were within 12KM of the 4800 figure, and the margin of error wasn't as bad as I feared. That simply blew my mind.

Sure, the image is 'processed' to accomplish a "test". That "test" falsified standard solar theory on the first day of operation, and HMI has since confirmed it's demise.

Whatever solar model survives the SDO data set, it is quite clear that it will *not* be the standard solar model.
 
Upvote 0
This site stays free and accessible to all because of donations from people like you.
Consider making a one-time or monthly donation. We appreciate your support!
- Dan Doughty and Team Christian Forums

Michael

Contributor
Site Supporter
Feb 5, 2002
25,145
1,721
Mt. Shasta, California
Visit site
✟298,148.00
Faith
Christian
How do you get the millions of degree corona below the photosphere, and still have that light go through the photosphere?

I don't. The hydrogen corona in a Birkeland solar model is located above the chromosphere just like standard theory. On the other hand, the flux ropes in a Birkeland solar model originate at the cathode surface far below the chromosphere, about 4800KM under the bottom of the chromosphere. The flaming orange chromosphere in the SDO first light image is 4800KM *above* the opaque "transition" region, and the "bright horizon" is that "green" horizon that we see between the opaque rigid surface of the sun, and the base of the chromosphere. The key *difference* between the solar models is that a Birkeland cathode solar model has current traversing all the layers of the solar atmosphere, and the solar atmosphere is *mass separated* by the element.

You can't. Even NASA states that the green material you are looking at is millions of degrees.
I can, and yes the material in the flux ropes is millions of degrees, and held at those high temperatures by the powerful currents that flow through them. They traverse the surface of the cathode just like Birkeland's experiments *predicted*.

The *single* most important "prediction" I could have made about the location of the "transition region" in relationship to the base of the chromosphere was confirmed on the very first day of operation for SDO. HMI data now confirms the demise of standard solar theory. Whatever is next for solar physics, kiss standard solar theory good-bye. Adios baby!
 
Upvote 0