Solar cycle minimum at the earliest in second half of 2008?
7 04 2008

Current SOHO: The Sun is blank again
The outlook for solar activity continues to be pushed further back as cycle 23 spots continue, such as the group of 3 seen last week, but no cycle 24 spots are being seen. NASAs convened panel of scientists obviously missed their mark of consensus in predicting cycle 24 would start in March 2008. There is growing concern over the delay in the start of cycle 24. Now a new prediction portends more delay. If we go to May or later before the solar min is reached, cycle 23 will be the longest cycle since the late 1800s. Now it is looking like cycle 24 may not get started until late 2008 or early 2009.
Here is a new forecast from Jan Janssens SOLAEMON the
SOLar
Activity &
Earth
MONitor web page:
In this statistical research, transits to cycles 12, 13 and 14 were considered, as well as transits to cycles 21, 22 and 23. The current transition towards SC24 was compared with foregoing evolutions.
The start of SC24 is not to be expected prior to July 2008, and in all likelihood might even take place only in the first half of 2009. This conclusion matches perfectly the results one can make from evolution of the number of spotless days. Nonetheless, SC23 would be one of the longest in over 100 years, possibly even in over 160 years.
It is looking like a Maunder minimum as far as the # of sunspots and the cycle slowdown.
http://en.wikipedia.org/wiki/Maunder_Minimum
List of researchers who have predicted we are headed for a major solar minimum and/or with it the next climate change to one of long lasting cold.
1. Dr. Habibullo I. Abdussamatov: Russian Academy of Scientists.
a. Kh.I. Abdussamatov. Optimal Prediction of the Peak of the Next 11-Year Activity Cycle and the Peaks of several Succeeding Cycles on the basis of Long-Term Variations in the Solar Radius or Solar Constant.
Kinematics and Physics of Celestial Bodies, 2007, Vol. 23, No. 3, pp 97-100.
b. Kh.I. Abdussamatov. Long-Term variations of the Integral radiation Flux and Possible Temperature Changes in the Solar Core.Kinematics and Physics of Celestial Bodies, Vol. 21, No. 6, pp. 328-332, 2005.
c. Comment: RIA Novosti, August 25,2006: "Khabibullo Abdusamatov said he and his colleagues had concluded that a period of global cooling similar to one seen in the late 17th century when canals froze in the Netherlands and people had to leave their dwellings in Greenland could start in 2012-2105 and reach its peak in 2055-2060
.He said he believed the future climate change would have very serious consequences and that authorities should start preparing for them today
."
2. Dr. David Archibald. Summa Development Limited. (Australia).
a. Archibald, D.C., (2006), Solar Cycles 24 and 25 and predicted climate response,
Energy and Environment, Vol.17, No.1.
Comment from paper: "Based on a solar maxima of approximately 50 for solar cycles 24 and 25, a global temperature decline of 1.5C is predicted to 2020 equating to the experience of the Dalton Minimum."
b. Separate paper: Climate Outlook to 2030. Summa Development Limited, Perth WA, Australia.
Comment from paper: "The increased length of Solar Cycle 23 supports the view that there will be a global average temperature decline in the range of 1C to 2C for the forecast period. The projected increase of 40 ppm in atmospheric carbon dioxide to 2030 is calculated to contribute a global atmospheric temperature increase of 0.04C. The anthropogenic contribution to climate change over the forecast period will be insignificant relative to the natural cyclic variation."
3. Dr. O.G.Badalyan, and Dr.V.N. Obridko, Institute of Terrestrial Magnestism. Russia, Dr.J.Sykora. Astronomical Institute of the Slovak Academy of Sciences, Slovak Republic.
a. Balalyan, O.G., V.N. Obridko, and J. Sykora, (2000), Brightness of the coronal green line and prediction for activity cycles 23 and 24,
Solar Physics, 199: pp.421-435.
Comment from paper: " A slow increase in (intensity of coronal green line) in the current cycle 23 permits us to forecast a low-Wolf-number cycle 24 with the maximum W~50 at 2010-2011."
4. Dr. Boris Komitov , Bulgarian Academy of Sciences, Institute of
Astronomy, and Dr. Vladimir Kaftan: Central Research Institute of Geodesy, Moscow.
a. Komitov, B., and V. Kaftan, (2004), The sunspot activity in the last two millennia on the basis of indirect and instrumented indexes: time series models and their extrapolations for the 21st century, paper presented at the International Astronomical Union Symposium No. 223.
Comment from paper: "It follows from their extrapolations for the 21st century that a supercenturial solar minimum will be occurring during the next few decades
.It will be similar in magnitude to the Dalton minimum, but probably longer as the last one."
b. Komitov, B., and V.Kaftan, (2003), Solar Activity Variations for the Last Millennia.Will the Next Long-Period Solar Minimum be Formed?" Geomagnetism and Aeronomy, Vol. 43, No. 5, pp. 553-561.
Comment from paper: " An analysis
has indicated that it is highly probable that the next long-period minimum of solar activity, which will possibly be not so deep as the Maunder and Sperer minimums, will be formed in the 21st century."
c. Paper by Komitov: "A Global Cooling Caused by Supercenturial Solar Minimum in Range ~0.8C 1.0C from AD 2008/10 AD 2070. Presented in Sofia, Bulgaria, Intl Conference on Global Changes. April 2007.
5. Dr. Ernest Njau: University of Dar es Salaam, Tanzania.
a. Njau, E., (2005), Expected halt in current global warming trend?,
Renewable Energy, Vol.30, Issue 5, pp.743-752.
Comment from paper: "
the mean global temperature variations reaches the next peak about 2005 after which it will expectedly be on a decreasing trend. Finally it is shown that
Greenland is currently in an ongoing cooling trend which is expected to last up to at least the year 2035."
6. Dr. B. P. Bonev, Dr. Kaloyan M. Penev, Dr. Stefano Sello.
a. Bonev, B.P., et. al., (2004), Long term solar variability and the solar cycle in the 21st century,
The Astrophysical Journal, Vol. 605, pp.L81-L84.
Comment from their paper: "
we conclude that the present epoch is at the onset of an upcoming local minimum in long term solar variability."
7. Dr. Tim Patterson: Dept. of Earth Sciences, Carleton Univ., Can.
a. Calgary Times: May 18, 2007. Indeed, one of the more interesting, if not alarming statements Patterson made before the Friends of Science luncheon is satellite data shows that by the year 2020 the next solar cycle is going to be solar cycle 25 the weakest one since the Little Ice Age (that started in the 13th century and ended around 1860) a time when people living in London, England, used to walk on a frozen Thames River and food was scarcer. Patterson: "This should be a great strategic concern in Canada because nobody is farming north of us." In other words, Canada the great breadbasket of the world - just might not be able to grow grains in much of the prairies.
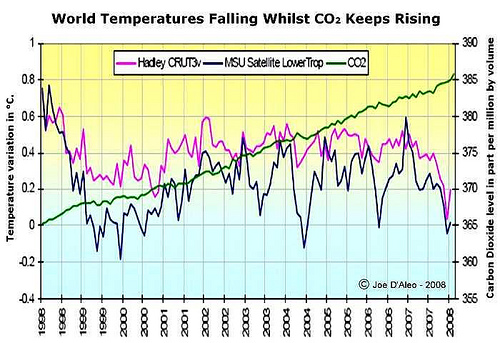
 I bet you didn't even notice the entire left label (Temperature Variance in C). You're not looking at the average temperature, you're looking at how much it changes from year to year. And it's largely above 0 meaning it's warming. This doesn't even support your position, the graph says the globe is warming.

 H[sub]2[/sub]O


