• Starting today August 7th, 2024, in order to post in the Married Couples, Courting Couples, or Singles forums, you will not be allowed to post if you have your Marital status designated as private. Announcements will be made in the respective forums as well but please note that if yours is currently listed as Private, you will need to submit a ticket in the Support Area to have yours changed.

  • CF has always been a site that welcomes people from different backgrounds and beliefs to participate in discussion and even debate. That is the nature of its ministry. In view of recent events emotions are running very high. We need to remind people of some basic principles in debating on this site. We need to be civil when we express differences in opinion. No personal attacks. Avoid you, your statements. Don't characterize an entire political party with comparisons to Fascism or Communism or other extreme movements that committed atrocities. CF is not the place for broad brush or blanket statements about groups and political parties. Put the broad brushes and blankets away when you come to CF, better yet, put them in the incinerator. Debate had no place for them. We need to remember that people that commit acts of violence represent themselves or a small extreme faction.

The Quiet Thread

I would suggest this thread to be the single locality of all those detailed, technical posts that, for some strange reason, people won't touch with a ten-foot pole. These are the singular posts that set up evidence or a problem, explain it, detail it, and, better yet, provide pre-rebuttals to the most common attempted refutations.

Then if someone comes along who thinks they can handle one of these monstrosities, they can feel free to start a new thread quoting the original post in which to attempt to tear it apart. I would ask that there be no constant bickering over the problems in this thread, but rather that it all take place in separate threads.

This would be the place for posts like MisterMistery's Impact Craters and WinAce's HERVs.

In addition to the above criteria, these arguments should be written or explained in the members' own words, instead of simply copy-pasting from another site (still keeping citations of facts, figures, and research). They should also preferably be kind and refrain from sarcasm and scathing. Remember, not everyone who comes here deserves that kind of attitude.

So, MisterMistery, if you would like to begin with your great information on impacts...

PS. If you have a post that you would like to see on here, you can also suggest it in this thread.
 

Deamiter

I just follow Christ.
Nov 10, 2003
5,226
347
Visit site
✟40,025.00
Faith
Christian
Marital Status
Married
Note: this thread should only include detailed arguments that have been ignored elsewhere (copy and paste of previous posts is allowed here, but only from christianforums, not from outside sources like AIG or TO).

It would be much preferable to include detailed argument (Winace's posts are a great example) rather than a brief summary and a link because, as Jet Black pointed out, directing others to an article does not promote education on either side.

Finally, I'd like to reiterate that arguments addressing these posts should be started as a new thread.

May this thread stay quiet as the title implies.
 
Upvote 0

Mistermystery

Here's looking at you kid
Apr 19, 2004
4,220
169
✟5,275.00
Faith
Atheist
Claim: Supernova's Remains (SNR) prove that the universe is not young.

sum-01-nova.jpg


Summary: Some creationists have claimed that there are no 3rd stage SNR. This post will explain that there are, what supernovas are, and everything else that deals with this phenomenom.
---
Okay, what áre supernovas? This is a pretty good question to start our exploration with. The word Nova comes from the Latin word for New star and basically indicates a strong, and rapid increase in brightness of the star in question. A star that has gone nova can suddenly become visible in the night's sky where it previously was completly undetectable.

Novae is a briefly reignition in the fusion reactor of the star. Let's assume here that we're talking about a sun-like star (meaning that the star looks like our sun) In the cores of the stars they transfer hydrogen into helium, and when the helium is used up the stars that looked like our sun begin to shed their outer "layers". It's basically the last stage of a star's life, and the star will develop into very hot and very small "white dwarf". Dwarfs are the inert cores of dead stars which have used up all of their available fuel.
web.jpg


Let's get back to supernovae: The "super" prefix means that it's diffrent from normal novae. Supernovae however use a completly diffrent mechanism. Supernovae also begin to shed their outer layers, filling its surrounding with hydrogen, helium and other elements, which will eventually form a cloud around the star of dust and gasses. When the explosion of a supernova compresses nearby clouds, it will give a huge flash of energy, and even compress the cloud around itself to form new star, enrich the surrounding space with elements, etc etc etc. A supernovae can release several times what our sun produces in her entire lifetime.

The very first notible super novae was witnessed in 1006 which has been reportted all over the world. Other famous examples include 1054 - 1572 - 1604 - 1987.

There are 2 types of supernovae: If a supernova's spectrum does not contain (or very little) a hydrogen line (also known as a blamer line), it is classified Type I, otherwise Type II. These can be subdevisioned into various groups. Type 1a for instance has a abundance of silicone(SI) absorption line for their lack of helium. Type Ib has a helium line present, but is thought to be the result of a Wolf-Rayet star collapsing. We'll not get into that. Other types of that show no Helium present are classified under 1c.

Type II supernovae are the result of far more massive stars then our sun, and are subclassified into a P for Plateau and a L for Linear types, which has something to do with their lightcurve moving in certain way. Let's not get into that either and skip to the end of the story: What remains of this massive explosion.

Like I said before, a supernova can enrich it's region of space with all kinds of material. A supernova remnant (SNR) is the remains of such a supernova explosion and are mostly build up of the building blocks of that star. They heat up the interstellar medium(ISM), transport heavy elements throughout the Galaxy, and accelerate cosmic rays etc etc. They are important to the whole universe. Infact if it were not for SNRs there would be no Sun or Earth.

The shell-remains can be classified under various types of remains, mainly the following: Shell-type remnants, Crab-like remnants, Composite Remnants (divadable under Thermal composites and Plerionic composites).

Here comes the important part: the various stages of SNRs. There are 3 main stages to recognise first, second and surprisingly third phase. In the first phase (AKA free expansion-phase), the shockwave that is the result of the supernovae explosion interacts with the ISM, and is recognisable at the constant temperature and expansion speed of the shell. The total duration of this phase is very short, about a 100 years.

The second phase (AKA Adiabatic Phase), you can see that the material slowly starts to slow down and cool down. The SNR material slowly begins to decelerate by 1/r^(³/²) and cool by 1/r³ (r being the radius of the SNR). This is because of the interaction with space the remains. In this phase, the main shell of the SNR under a phenomenom called the Rayleigh-Taylor unstable, and the SNR's ejecta becomes mixed up with the gas that was just shocked by the initial shock wave. In this stage here is an increasement of the magnetic field inside the SNR-shell, and also various also types of processes. As you can see, it's very diffrent from stage 1 (and stage 3 as you will see in a bit), and lasts for 10 or 20 thousands of years.

The last phase is called the snowplower phase and begins around the time when the shell has cooled down to 10^6 kelvin. At this temperature heavier atoms and electrons begin to slowly recombine themselfs so that the shell as a whole can more effeciently begin to radiate it's energy. This is the final blow to the remains, ebcause it means that the shell cools faster (dependable on size). The more it begins to cool, the more atoms begin to recombine, the more it cools, etc etc etc. It basically becomes a snowballeffect. The remains become more dense, and thus shrink (at approximatly 1/r³) more.

When this gets underway the SNR quickly develops a thin shell which radiates all of it's availible energy away in optical light. Outward expansion comes at a fullstop and the SNR starts to collapse under its own gravity. Note that this is not always the case, I will get to this in the next chapter. This lasts a few hundreds of thousands of years. After millions of years, the SNR will be absorbed into the interstellar medium completly due to (amoungst others) the Rayleigh-Taylor instabilities.

----
"How do we Know a Supernova Remnant's Age?" is the following question we should ask ourself. If the supernova explosion was recorded in history, as is the case of many SNRs less than a few thousand years old, we know the age of the corresponding SNR (because we can use various measurements of stellar distances, see also this responce to NapaJohn )

This is however not a really reliable source, because it is not always certain if the recorded guest star was a supernova or was the same supernova as a corresponding remnant. It is therefore important to be able to estimate the age of SNRs via other ways.

An relativly easy way to get to the age of a SNR is to measure the temperature of the hot gas using X-ray spectroscopy. From this observation we can estimate the velocity of the shock wave, and then infer the age from the shock velocity. This works because the velocity of the shock slows down with time as it engulfs more material and cools. Though I must point out that this is not a very accurate method, and should only be used to overlap with other measurements-methods, because there are a number of complicated processes that can heat up or cool down the gas which are independent of shock velocity.

A better way, is to measure a SNR's expansion over time and apply the equation

rate x time = distance.

For example if we observed a supernova remnant both 20 years ago and today, we would have two images 20 years apart. Comparing the sizes of the two images and dividing the difference by 20 years, yields the rate at which the SNR is expanding. For example, if we found that the supernova remnant expanded by 5% over the 20 year period, then the the rate of expansion would be:

rate = 5/ 20 years = 0.25 /year

Because the SNR expanded 100% since it exploded, its age can be calculated in the following manner:

time = 100/ (0.25 /year) = 400 years

vela.jpg


With the above example, it is safer to say that the supernova explosion happened less than 400 years ago, because it is quite likely that the SNR's expansion has slowed down since the explosion (whereas it is unlikely to have sped up). An age calculated according to this method is more likely to be accurate when calculated for the fasting moving features in the supernova remnant or the result agrees with historical records. There are other methods, like Lum method, Light Echo Distance, The doppler effect in coöperation with the Hubble constant law (Ho) D = VR/Ho, Type Ia Supernovae effect (raising the mass above the maximum mass limit (Chandrasekhar) making it possible to calculate distance), and various amount of stellar parralaxxen. But they are harder to calculate for yourself. Still with enough study you can get it down as well.
 
Upvote 0

Mistermystery

Here's looking at you kid
Apr 19, 2004
4,220
169
✟5,275.00
Faith
Atheist
As previously said over a great lenght of time this 3th stage remnants will simply dissapear. This works well in theory, but just like with fossils, there are other processes toaccount for in practice. Some of the reasons why the 3rd stage remant are not reached full stage are:

- The ISM in which supernovae occur is rarely isotropic or of a uniform consistency and density, which leads to asymmetry and differences within the remnant (Dohm-Palmer & Jones 1996; Maciejewski & Cox 1999; Slavin et al. 2000).
- If a supernova occurs in a pre-existing bubble of interstellar material surrounded by a massive shell of gas then the Sedov phase will not necessarily occur (Wheeler et al. 1980; Franco et al. 1991; Franco 1994; Gvaramadze 2000), indeed, the SNR may not be detectable at all in this scenario unless it hits the walls of the shell (Fich 1986; Koo & Heiles 1995; Chu 1997).
- If the density of the medium in which the SNR is located is low enough, it is possible for the SNR to finish its life by merging with the ISM before cooling becomes important (Asvarov 2000).
- Different stages can occur simultaneously in different locations within a single remnant (Cioffi et al. 1988; Tenorio-Tagle et al. 1990; Franco et al. 1994; Jones et al. 1998; Asvarov 2000; Bykov et al. 2000; Reynoso & Mangum 2001).
- If the ISM is strongly magnetized, then the evolution of the SNR will differ in terms of the length of the various phases and the overall shape of the remnant (Insertis & Rees 1991).

What I'm trying to say here is that the argument that Supernovae are relativly easy to put in a box, is not as easy as it seems. Therefor the gist of the creationist argument is right. Observations of ongoing radioactive decay in supernova remnants can only date the very young ones (up to approximatly 18,000 years old). There are not many 3rd stage supernovae remnants, but that doesn't mean that there aren't any at all!

Again after a long time the remnant can be disperged so much it's not possible to trace it back with the equipment we have now. Supernova remnants are relatively hard to see they would not be visible for billions of years. Therefor it's not possible to use it as a reliable source for the age of the universe. Fewer than 1% of SNRs last more than 100,000 years. It may be that as few as 15 to 20% of supernova events are visible at all through the interstellar matter.

However if the universe was young we sohuldn't be able to see even one 3rd stage remnant, which is not true.

The Galactic HI shell GSH 138-01-94 studied by the Canadian Galactic Plane Survey (CGPS), has detirmined the expansionage of GSH 138-01-94. It's 1.3 Million years (an extreme find, others have tested it to be around 4 million years, but let's not get into that).

See the point is that many more SNRs have been found, including many stage three remnants older than ~20,000 years. Look at the cygnus loop, or Velax for instance! There are supernova remnants have reached the third, oldest stage. That they get thorn up so much after such a long time is just plain common sense.

An other problem inadvertably tied to the creationist problem is that all supernovas and SNRs so far are more than 7000 light years from us. SN 1987A was 167,000 +/- 1,000 light years away. How is that possible? Why does God want to see us stars explode that never exsisted?

Now if the goal of this is to find the age of the universe, supernova remnants are not the objects to look at. This is simply because they become mixed up with the interstellar medium after only about 100,000 years. That's why they are so hard to see.
----
Conclusion: The evidence contradicts a young universe though, not an old one.The formation of new stars indicates that many are second-generation; the universe must be old enough for some stars to go through their entire lifetime and for the dust from their supernovas to collect into new stars.

Check here to see that the number of supernovae (not even counter the extargalactic ones) has been far outnumbered in 2003. Long story short: there are 3rd stage supernovae remains, which are over a couple of hunderds of thhousands years old.

Read more about them here, here, and especially here. Or do a search on these forums with my name and supernovae.

Supernovae are solid evidences that the Universe is old, period.

Add. reminder: Armstrongbands of types of SN:

Type Ia Si II line at 6150Å
Type Ib He I line at 5876Å
Type Ic Weak or no Helium lines
and
Type II-P Plateau
Type II-L Linear

Additional sources and acknowledgements: Besides the links allready listed I would like to acknowledge a Dutch book called "stargazing vol 2" 1997, Note that since that time more measurments from hubble have been given to detirmine and validate these formulas/theories/ideas.

Also, the second part of this list is mainly taken from Edward L. Wright, Malcolm Longair and Malkan CSEOL-studies.

Hubble constant law a.o. by Donald Goldsmith.

http://www.daviddarling.info/encyclopedia/S/supernovaremnant.html
http://cdsaas.u-strasbg.fr:2001/PASP/journal/issues/v110n744/970015/970015.web.pdf <<must see
http://imagine.gsfc.nasa.gov/docs/features/exhibit/cgro_snr.html
http://www.rochesterastronomy.org/snimages/ << must see
http://www.talkorigins.org/indexcc/CE/CE401.html
http://www.infidels.org/library/modern/dave_matson/young-earth/additional_topics/supernova.html
http://www.talkorigins.org/faqs/supernova/ << must must must see site.

D.A. Leahy & B. Aschenbach, "ROSAT X-ray Observations of the Supernova Remnant HB 21", November 1996.

And last but not least, Apod.


---
And I prolly forgot a few, if you think I missed out on someone, or something, please point it out. Also comments are greatly appriciated.
 
Upvote 0

Mistermystery

Here's looking at you kid
Apr 19, 2004
4,220
169
✟5,275.00
Faith
Atheist
Claim: Ica stones are hoaxes, QED

Summary: A horrible hoax gone horrible wrong. I find this one of the more annoying "arguments" creationists use, and this post deals with this specific argument. Post is a revision of one of my older posts in a thread called "Ica stones, not Inca stones"

History:

In 1994 scientists were stunned by the accidental discovery of some spectacular prehistoric paintings of horses, rhinoceros, lions, buffalo, and mammoths on the walls of a cave at Ardeche Valley, south-eastern France, considered to be the world's oldest paintings (between 29,700 and 32,400 years old) (Chauvet 1996). Are there, anywhere in the world, similar paintings depicting dinosaurs?

Yes there are, according to some, but they are not drawn with charcoal on some obscure grotto, instead they are carved on thousands of rocks of various shapes and dimensions, apparently hand-etched some 65 to 230 million years ago ( or 6000 as creationists say). And what do these etchings show? You guessed it: brontosaurs, triceratops, stegosaurs, and the whole dino collection of beasts!

That alone would have made the most sensational discovery ever, not only able to eclipse the beauty of the Chauvet paintings, but also most everything else discovered so far.

But wait, there's more! Some other stones, in fact, depict pictures of primitive men hunting and killing dinosaurs and other men flying on the back of pterodactyls. What tops them all, however, are some precisely detailed drawings of ancient men watching the heavens through what look like telescopes and others piloting flying machines or performing open-heart surgery, cesarean section births, and brain transplants! (Taken from csicop.org 2002/09)

Let's look at the story and evidence first before we jump to conlusions, shall we? In 1966, in Ica, a town on the south coast of Peru, when a Peruvian physician, Dr. Javier Cabrera Darquea, received a small carved rock as a gift for his birthday from a local farmer. The carving looked ancient but when Dr. Cabrera saw it the first thing he thought was that it was a drawing of an extinct fish. (Dramatic plot noise)

From that moment on, hearing of the extreme interest that the good doctor showed for that rock, local natives approached him with the fantastic news that if he wanted more stones they had a few and could sell them to him. Eventually, he got so many of them (approximatly 15,000) that he allegedly abandoned his career in medicine in Lima to open up the Museo de Piedras Grabadas (Engraved Stones Museum) in Ica where he housed his collection.

Problems with this all:

- First problem is the kind of people who support this claim. Again one of the leading people who spread misconceptions over this topic is again Eric von Dänicher. This man also spreads misconceptions about things like aliens, Nazca lines (see my thread about those) and many others.

- Secondly the horrible background story reeks of hoax. There are a couple of points that spring to mind here in this original story:
1) Since when does one need to get specialized knowledge in extinct fish to become a medical doctor? If not how could he know what kind of special extinct fish this was?
cabrfish.jpg


2) Exactly what kind of extinct fish is depicted on that famous first stone?

3) How is it that if there once was such an evolved civilization able to build telescopes and flying machines, and perform microsurgery, the best they could do to preserve the memory of their existence was to carve crude drawings on some stones? Why can't we find these magnificent telescopes/tools and other things. This brings us to point 4:

4) If such a civilization really existed, why is it that nowhere else in the world can traces of their existence be found?

5) Why is it that no dinosaur's fossils can be dated to an age contemporary with man? Why are there no human fossils found with dnio fossils?

6) Where did those stones come from?

- To immidiatly go to point 6; No one knows this. Normally stones are dated on the strata in which they are found, because radiometric dates on these stones is pretty pointless. But that's the point isn't it? There is no "cave of origin" which apperently was "uncovered via a mudslide of a nearby river". The cave has never been investegated, never uncovered, never made public. Strange, because if these stones were real our good docter could be quite famous.

- That no one has ever found any other remnant of this great culture is quite troublesome. Such a great society might have left at least some garbage or some ruins, maybe even a bone or two, a grave here or there, or a temple, a hospital, an observatory, an airport. But this great civilization, unlike every other great civilization of the past has vanished without a trace, except for Cabrera's stones.

- Also the actions in the pictures are impossible. Let's look at the dino riding in the pictures and let's assume for a second here that dinosaurs and humans co-exsisted.


ica_1.jpg


Let's also assume that dinosaurs were tame enough to be ridden, even the biggest flying lizard: Quetzalcoatl. Other Pterosaurs are unsuitable because they are to small. And with a wingspan of around 11 meters this Quetzalcoatlus was the largest flyer ever. This was a cold-blooded* slow flying lizard that probably used it's wings and the sun to obtain heat. With powerful flight muscles, it's believed that these creatured weighted between 50-100 kilo.

Hold it.. How much did I say? Only approximatly 100 kilo tops? How did that came to be? Because for flight the creatures had to be enormously light and large. Their bones are hollow. If humans were going to sit on them their weight would double and render them incapable of flight. not only that, but because their bones are hollow the bones would inavertably snap. Breaking the creature in half.

That's not all, but the drawing doesn't suggest a Quetzalcoatl-lizard, but rather a Pteronodon. Probably is this drawing from a famous study that Hankin E. H. and Watson D. S. M.(On the Flight of Pterodactyls, The Aeronautical Journal, October 1914) conducted. Problems: wingspan is up to 7 meters and the critter weighs 20-35 kilos. Not only that, but the picture clearly has teeth. Teeth a Pteronodon doesn't have.

I've even heard the bizzare assumption on creationist websites that the drawings were in fact Pterodactyl. The Pterodactyle has teeth, but look here at this size comparision between a Pterodactyl vs a pterodont vs a human. I rest my case:
ptero_compare.jpg


* There is no fossil evidence of feathers on this family, but some pterosaurs were unique among reptiles and some are thought to be covered with hair. Some fossils such as those of Sordes pilosus ( the "hairy demon") do show the unmistakable imprints of hair on the head and body, not unlike modern-day bats. The presence of fur imply that some pterosaurs were warm-blooded ('endothermic').

- An other point is the drawing's perpective. It's not in the icon-style that we know from that region. Even in the best of the Mayan art, they didn’t do 3/4 views. Everything in the 2-D paintings looks flat, with no depth, it's either side-views of bodies or profiles. The heads are almost always shown in profile.
True artists
http://www.misericordia.edu/users/d...aya/masters.htm
http://www.misericordia.edu/users/davies/maya/ahaus.htm
http://www.misericordia.edu/users/davies/maya/women.htm
Versus hoaxers
http://www.weirdvideos.com/cabrtran.jpg
http://genesismission.4t.com/dinosaurs/Ica_stones-2.jpg // http://img48.exs.cx/img48/2741/ica_2.jpg

Notice the diffrence? Notice how detailed the heart is? Notice how the perspective is like that drawn out of a medical book? Notice how they are completly diffrent from other drawings from that region? The 3/4 views didn’t start to be used in drawings until after the Spanish brought paintings and drawings to the Western Hemisphere

- As compensation for these shortcomings, however, one could read a very revealing interview with a Basilio Uchuya and his wife, Irma Gutierrez de Aparcana, two peasants from Callango, published some years ago by Mundial magazine (1975). In it, Basilio and Irma admit that all of the stones they sold to Cabrera they had carved themselves. As for the subjects to be depicted on the stones it was easy: they chose illustrations from comic books, school books, and magazines.

Conclusion:
Tourists, not just in Peru, but everywhere on earth where there are antiquities, have been suckers for forgeries. Local conartists are aware of the market, and are willing to supply ancient ossariums, Dragon-teeth, stones wich depict all kinds ancient history etc, etc.


Claims that Spanish explorers in 1562 had the exact same stones are unsubstantiated.

Modern-Ica-natives had been selling such stones to the tourist trade. In fact, when one man was arrested for selling them (if the stones are genuine artifacts, they would be the property of the government and therefore illegal to sell), he confessed to carving the images himself. Here is a picture of a local person who makes stones. James Randi (who is an expert on Peruvian artifacts) went to check this ica-thing out, and this is from his book flimflam.

dino-faker.jpg


Finally, a recent examination of the stones, done in Barcellona 2003 by José Antonio Lamich, founder of the Spanish "Hipergea" research group, revealed signs of sandpaper and recent carvings. When questioned why they did it, the hoaxers answered that etching stones were indeed done by them.

It's one big fat hoax, used to trick you. There are reports of people who made the stones, scientifical independant investegations, biological impossibilities, unknown origins and I don't know what else wrong with it.

Sources:
Besides the one allready listed

- 1975. "Confront: . . . Las hizo Basilio Uchuya." Mundial, No. 6, January 17.

- Cabrera Darquea, Javier. No date. The Message of the Engraved Stones of Ica. Ica: Privately Printed. (!)

- Carroll, Robert Todd. 2002. "The Ica Stones," in: The Skeptic's Dictionary (skepdic.com/icastones.html). - Skeptical Inquirer, 26(3), May/June 2002: 21-23.

- I qouted a couple of passages from Sam5 over at bad astro.

Additional info: So, assuming the Ica stones are a hoax, how about the sheer number of them? 15.000 stones - there must have been a small army of forgers churning out stones continuosly.

If he, his wife and some locals produced the stones, it wouldn't take that long, 8 hours for a big detailed stone perhaps. Some say 30 minutes for a small one, I dunno. I have no idea on the exact number of stones, because a lot of them have been sold to tourists. Again this is quite problematic for the whole silly idea.
 
Upvote 0

Mistermystery

Here's looking at you kid
Apr 19, 2004
4,220
169
✟5,275.00
Faith
Atheist
Claim: Ice-cores prove that the Earth is more then 100,000 years old *at least*. This means

Summary: Post adreses and explain most basic questions about ice-cores. As an example I will talk about the ice-cores mainly from Vostok and the Greenland Ice Sheet Project Two (GISP2). I will also debunk a couple of smaller "refutations". Post is a re-edit from an old thread (John will remmember it, I'm sure). Note that not all sources are complete, and I'm sorry for this. Please to be sending me information if you know that I've forgotten someone.

What is an ice-core, where are most from, and how are ice-core samples taken most of the time?

Ice-cores are cylinders of ice drilled out of glaciers and polar ice sheets. They are our link to the past can give us an revealing look what was going on on planet Earth at the time. Scientists from around the world are studing these cylinders with state of the art analyses so they can resolve questions about how the climate system functions, and how it functioned in the past. I'll talk more about it later. Here's a picture for those people who don't know how such a freshly drilled cylinder looks like:

core_sml.gif


There are many researchers dealing with ice-cores in the world. A good question of course is where do these ice-cores come from? The National Ice-core laboratorium (an institute that researches ice-cores) has their research sites on their website, and have made these nifty images.

ant7.gif


green.gif

And two smaller ones : http://nicl.usgs.gov/gif/wash.gif and
http://nicl.usgs.gov/gif/wyo.gif

So mainly you can conclude that greenland and antartica have been a rescource for these people.

The ice-cores are drilled by specialised teams, much like in the same way as they drill for core-samples of the Earth, or for oil. There used to be huge riggs and towers needed to drill deeep enough, like on this picture from one of the vostok ice-cores:

But it's nowadays also possible to use smaller more effcient drills to drill down into the ice. Like this one:

After the selection of the site these mechanical drills can penetrate up to 3 feet (1 m) at a time before being withdrawn for the core to be recovered. To reachapproximatly 200 year depth, the team will have to drill around 60m which will typically take about a day.

Ice cores are about 10 cm in diameter. As they are brought to the surface a scientist will examine the core and attempt to place that section of core in time. Alternating bands of light and dark snow can been seen when light is shone through the ice core from behind. The light layers represent summer snow and the dark layers are winter snow.

More sophisticated techniques for dating ice cores are done later back in the lab, we'll get to that in a sec.

These are 9 basic steps you need to follow when you get a core sample (mostly taken from the GISP2 team) :

1. While the core is traveling to the surface, data sheets needs to be filled in, so that the ice-cores are correctly cataloged. Information that is needed includes: the date, the time the core was broken from the bottom of the bore hole, the drill run number, the run length as measured by the drill operator, the time the core reached the surface, the length of the core that is retrieved, the dome temperature, the time the core is sent to the trenches, and any pertinent notes.

2. The core length measured by the Core Handlers should be determined by the sum of the measured lengths of the pieces of core for each run, including any implied gaps.

3. The only information that should be recorded on the drill dome data sheet while the core is actually being processed is the core length measurements, and any notes that must be written down at the time. All the other information should be recorded either while the core is traveling to the surface, or is on its way to the trenches.

4. Cutting the Core. The core will be extruded from the core barrel. The core should be cut at exactly the 2.000 meter mark, whenever there is not a break in the core within 2 cm of the 2.000 meter mark. These cuts are very important as they set the depth scale for the core. They must be done carefully and accurately. Accuracy of at least 0.5 cm should be maintained. If a cut is made at other than the 2.000-meter mark, or a break within 2-cm of the 2.000-meter mark is used in place of a cut, this must be recorded on the top of the core card at the time the cut is made.

5. Every 10 meters an 11 cm physical properties sample needs to be cut. A list of where these samples are to be cut will be provided by the Data Manager. The Core handlers should communicate with the physical properties personnel in the trench 10 - 15 minutes before the sample is to be cut so they can be in the dome to pick the sample up. The physical properties personnel should mark the core card indicating the sample that has been removed.

The physical properties personnel may either collect the 11 cm sample in the drill dome, or in the Feeder Trench after the core has been lowered. Where the sample is collected can be determined on site.

6. A sample will be collected for helium analysis in the drill dome. Because of the rapid rates of diffusion for helium, these samples must be taken as soon as possible after the core is extruded from the drill. These samples may take the form of a large chip or chunk or may have to be cut off with a saw. The actual sample is on the order of 3x3 cm.

7. The core should be wiped down with towels to remove most of the nBA from the core as it is moved to the core elevator. The nBA is found to evaporate quite readily, and wiping is intended to assist this process.

8. Each time a core section is cut to 2 meters, a new Core Card is started. Core cards are pre-printed with the meter depths and tube numbers. Since every meter of core gets one core card, there will be two core cards for each 2-meter section cut in the drill dome.

In the dome the only information that should be recorded on the core cards is the drill run number. Core handlers should use the measured length of the core to determine how many core cards to take with them to the trench. it is very important that this information be put on each Core Card used each run. If a core tray is only partially filled by a run, the number of the run that completes the meter should also be recorded.

9. The entire run of core should be processed, with each 2 meter section being placed in the core elevator as soon as it has been cut and had its core card noted and attached. When all the core from a given run is in the elevator, all the core should be sent below at once. This entire process, from the time the core reaches the surface to the time it is lowered into the feeder trench, takes on average 45 minutes.
So how is it cut into pieces?
This is a crosssection of an ice-sore sample. Again taken from NIC
exal.gif


The worst place to investegate such a core is allong the edges. The drill has come into contact with this part of the sample, and probably has screwed up the sample allong the edges. It's not actually the drill itself that causes the problems, rather the Butyl Acetate (nBA) that flows around it. nBA is a volatile fluid used to prevent the bore hole from collapsing under the weight of the ice cap.

They take nBA because it meets several criteria: it does not corrode or contaminate the core, it is relatively safe for humans, it is relatively safe for the environment, and it is relatively inexpensive. Still, it's better to be safe then sorry, so when you begin to investegate a sample, take a small slice from the inside.

Usuall the cores are spliced into two parts, this is done for a couple of reasons, one of them is to ensure accuracy. Small fragments or complete cores can go to various labs, but there is one thing that always needs to be ensured: the temprature should stay low. that way the enviorment has no effect on the accuracy of the core samples.

So... what do they look for?

Ice cores contain an abundance of climate information and although their record is short in geologic terms, it can be highly detailed. An ice core from the right site can contain uninterrupted, detailed climate record extending back hundreds of thousands of years.

This record can include temperature, precipitation , chemistry and gas composition of the lower atmosphere, volcanic eruptions, solar variability, sea-surface productivity and a variety of other climate indicators.

Most importantly (the thing that we all came for), let's date the ice-core samples:
The Vostok station in the east of Antarctica reached in 1998 a depth of 3623 m. This sample alone did provide us a continuous ice core record spanning 420,000 years. But how do we know that?

1) One of the most abstract ways to date ice-cores is using sun-spots. The sun has an 11 year cycle with increased solar activity at the end of this cycle. Suprisingly (not) this also leaves an impression on the ice-cores. This is done via 10Be measurements, So one can see the solar cycle in cosmogenic isotope production. Scientists compare measured thicknesses with the layer thickness profile predicted by a finite element ice flow model.

The results are in good agreement, supporting the assumption that the length of the solar cycle has remained essentially constant throughout the Holocene. For ice cores where annual layers are not preserved (possible sometimes), the [size=-2]10[/size]Be 11-year layer method can be used as an independent check on the flow-model estimates of layer thickness and to estimate past accumulation rates. It should be possible to accurately date ice cores by counting 11-year layers detected with continuous high-resolution [size=-2]10[/size]Be measurements.

2) Counting the layers is the most easy way to detirmine how old a sample is. 1 question springs to my mind when I say this: What does one layer represent?

There are two possibilities, either a layer could be one year; or each layer could be one snowstorm. But how do you detirmine this?

One way is to measure an isotope¹ratio. Specifically, the ratio of Oxygen-16 to Oxygen-18. These occur naturally in ocean water and not in air, and form water molecules of slightly different weight. The heavier water molecules don't evaporate quite as easily. So, it's not surprising that the heavy-to-light ratio is a bit larger in the ocean than in Arctic and Antarctic snow. And, the ratio in the snow changes, with more "heavy" molecules in the summer than in the winter.

A particularly warm year, or cold year, would affect this. But in any case, as you measure deeper and deeper in the icecap, you would expect the ratio to go up and down and up and down. In short, it should be cyclic, until you get so deep that everything smears together. And each cycle is one year.

So, now we have a way to answer the basic question: how many layers per year? And the answer turns out to be: one. The deviation from 1:1 is much less than 1%.

3) Other isotopes are used as well. Though the previous mentioned one is used most. Zirkon dating is also used, still not as much as with volcanoes, because it isn't as abundant in the ashes of volcanoes.

4) An other method is to use air bubbles trapped inside the ice. That way they can see not only temperature but also atmospheric composition. With this new method, temperature is estimated by very precise analysis of the isotopic composition of the argon in the air bubbles.

The sequence of events can then be reconstructed. The warming in Antarctica, probably initiated by changes in insolation. Then increase in carbon dioxide content that started about 800 years later but took place a few thousand years before the thaw of the ice caps that marked the main stage of the deglaciation. This sequence is consistent with what qw know about how carbon dioxide contributed, through various retro-actions, to amplifying the very low effect of the changes in insolation, and thus participated actively in deglaciation. I admit, this may seem abstract, but this way you can also find paterns in the ice, which give you the time of the cores samples.

¹ = Not all atoms of have the same weight. Some atoms have more neutrons than "usual", and some have less. They're all the same element (like AU for isntance) chemically, because the chemical properties are controlled by the outer electrons, and a neutron 'way down in the nucleus has no effect on electrons.
Some isotopes aren't stable, and the nucleus can come apart. That is an radioactive Isotope. For example Carbon 14 is radioactive, but Carbon 12 isn't. There are also diffrent degrees of radioactivity. Uranium 235 is very radioactive, but Uranium 238 is only mildly radioactive.
Conclusion:

according to the vostock ice-core allone The minimum date of the Earth should be at least around 100.000 old. While other echniques can be used to get to an age of 420.000 years, it is clear via simple ones like counting that there are 100.00 of annual layers.
 
  • Like
Reactions: USincognito
Upvote 0

Mistermystery

Here's looking at you kid
Apr 19, 2004
4,220
169
✟5,275.00
Faith
Atheist
Counterclaims: Now, lets look at the lost squadran. In 46 years the ice was 75 metres. That works out to about 1.6 meters.
http://www.answersingenesis.org/docs/233.asp

No where in my statement do I use ice-growth, ice-lenght or anything other lenghtening measurement. This is again an dishonest way to try to discredit normal science.

Besides sounding very vague, I also have serious doubts on the credentials of these people who were trained in returning the aircraft. They don't mention that anywhere their credentials. These points could have been better explained if the article was more clear about it.

They do say that they are resp. a US airplane dealer and an architect. Now did those 2 people learn about ice-core, or about icereadings in general? Not a lot. Did they count layers, or just measured the depth of the thing? Did they make preciese measurements like the people who escavated the vostoc ice-core? Did they use 10be measuring? Nope? hmz.

Is there a better more scientifical explaination availible? why yes!

Ice accumulates faster or slower over the whole world. That that's the case here. Therefor it's quite possible that they got under more amount of snow then in the south pole (see my next post as well). On top of that, the whole plane got hitched by a gleyser. They even basically say it for crying out loud:

To their disappointment, the huge bomber was crushed and mangled, beyond worthwhile salvage.
And whattah you know, it really does seem that way.

tldr version: The airplanes landed near the shore of Greenland, where snow accumulation is rapid, about 2 meters per year. Allowing for some compaction due to the weight of the snow, that accounts for the depth of snow they are buried under. The planes are also on an active glacier and have moved about 2 km since landing.

Ice core dating takes place on stable ice fields, not active glaciers. The interior of Greenland, where ice cores were taken, receives much less snow. In Antarctica, where ice cores dating back more than 100,000 years have been collected, the rate of snow accumulation is much less still.

They didn't drill, they steamed. I wonder how anyone can get trustable data on the amount of layers out of that. Also note that I nowhere use the lenght of the ice-core to detirmine the age.

---
additional info:
This is an image I snagged from newscientist from an article about this "newer" ice-core mentioned in post number 3.
99994121F1.jpg

If you look at any ice-core you will see that the beginning is incredibly detailed. Where in the middle-part you only can count the layers, in the beginning you can even distinguish seasons! And you can for instance see nuclear tests in the top. I will not go in any further at what else one can see in it, but it's important to understand that the first part has larger parts of snow, and the lower you get to more it smaller it gets.

Now, the more snow builds up, the more the layers compress. This is pretty obvious. Eventually iceflows in the compressed part near the bottom, can completly erridicate those annual layers, and the only way to detirmine what year the ice builded up is to look at the other methods I've allready mentioned.

The big question is "how do we know that one layer = one year".

1. My first reaction is this: Let say that the vostock ice-core is only 400.000 layers, and for sakes of argument that the flood also happend around 4000 years ago, so that would mean that ice builds up on that place for 4000 years. Let's also say that we use the creationism argument that layers = snowstorms.

A simple equasion (# of rings / # of years) would give us the amount of snowstorms that hapen in a year, right? That would mean that around 100 snowstorms a year happen on that site. This is rather odd, because the weather on the antartic is to be divided in 3 climatic regions
- The interior of the continent is extremely cold with little snowfall
- The coastal areas have milder temperatures (though still very cold) and much higher precipitation rates (though still in the desert range)
- And the Antarctic Peninsula region which has a warmer and wetter climate, with above-freezing temperatures being common

Here's an image (from msn) that gives you a better idea of how much precipitation there is per year:
T028737A.gif


The Vostock core was of course taken from the first part, so the question is how do you make 100 snowstorms a year, and make them with less then 50 mm of rain. also, is there anyway to form +3 km of ice per 4000 year with 50 mm of snow? that aside, let's look at some other things first.

2. This website (first link in google) gives some info about this phenomenom as well: In general, white layers in a glacier represent a time when ice accumulated and little melted. In the picture linked you can see the diffrences in the ice. come back a year later and you can see that other layers have formed. come back one snowstorm later and you will see that it did not create any more dark and light layers.

Dark areas represent a time when much ice melted, causing the rock material to become concentrated. The resulting light/dark layers are indicators of seasonal and climatic changes. Of course over time this gets sondesend into one smaller and compact package.

Allong these lines we can also identify annual layers in the ice because the concentration of sea salts, nitrate, mineral dust and the gas content in winter snow are different than in summer snow.

3. An other way to detirmine what is one layer is to measure the isotope-ratio of Oxygen-16 versus Oxygen-18. what I mean by isetope ratio (and I will try to explain this as good as possible) is that not all atoms have the same weight.

Some atoms have more neutrons than normal, and some have less. They're all the same element (like AU for isntance) chemically, but some aren't stable, and the nucleus can come apart. That is an radioactive Isotope. For example Carbon 14 is radioactive, but Carbon 12 isn't. There are also diffrent degrees of radioactivity. Uranium 235 is very radioactive, but Uranium 238 is only mildly radioactive.

Stable isotope analysis can provide powerful tools for water science research. Changes in the isotopic composition of compounds can be predicted from physical laws. Natural variations of the abundance of isotopes of hydrogen, carbon, oxygen, and nitrogen can help researchers discover the origin and flow of these elements in the environment for instance. But for ice-core research we stick to the Ox16 and 18 bit.

Oxygen-16 and 18 occur naturally in ocean water and not in air, and form water molecules of slightly different weight. The heavier water molecules don't evaporate quite as easily. So, it's not surprising that the heavy-to-light ratio is a bit larger in the ocean than in Arctic and Antarctic snow. And, the ratio in the snow changes, with more "heavy" molecules in the summer than in the winter.

A particularly warm year, or cold year, would affect this. But in any case, as you measure deeper and deeper in the icecap, you would expect the ratio to go up and down and up and down. In short, it should be cyclic, and tada, each cycle represents one year.

4. Indirect evidence. There are many indirect evidences. Let me explain one of them. In both the Vostoc core, and in the GISP core (and others btw) there was a pretty big deposit of volcanic ashes after around 1460 annual layers.

This was the largest volcanic fallout deposit in the last 700 years. And recent historical evidence suggests that the volcano Kuwae, in Vanuatu erupted about this time, in a huge explosion that destroyed an island. Historical records, and even tree-ring records have suggested a date of approx 1456, so this is a little off to what our ice-cores say, right? The thing is, that volcanic fallout does take a while to reach the polar icecap, so the earliest ice-core date for this eruption is 1456.

There are many mysteries around this eruption that we won't go into here, but the point stands that it would be remarkable that all those volcanic ashes deposited itself in one ice-storm edit, this as seen from the creationist side of the story. This layer is also a crosslink to other sources like for instance tree-rings, and personal accounts.

You can safely conclude that one layer = one year. There are many diffrent types of cross-references out there.


Sources:

Crossreferences
http://www.ees.nmt.edu/Geol/volcanology/wave.html
http://www.geo.arizona.edu/palynolo...23climaros.html
http://whyfiles.org/021climate/fire_and_ice.html
http://arcss.colorado.edu/data/gisp...ent/format.html
http://www.innovations-report.de/ht...icht-10541.html
http://www.gaspig.com/volcano.htm
http://www.personal.rdg.ac.uk/~lasmanng/volcano.htm
http://www.brightsurf.com/news/nov_...ws_110703_b.php
various amounts of icecore details.

http://www.ngdc.noaa.gov/paleo/icecore/current.html

http://www.ngdc.noaa.gov/paleo/paleo.html
The History of Climate Dynamics in the Late Quaternary (pdf 2mb)
http://www.gisp2.sr.unh.edu/DATA/alley1.gif
http://www.gisp2.sr.unh.edu/IMAGESGISP2/Bender-NSF.GIF

http://geosci.uchicago.edu/~archer/...1.since_65M.pdf
http://www.climate.unibe.ch/~stocke.../epica04nat.pdf

http://www.liv.ac.uk/Geography/Html...s/Geology00.pdf

http://www.liv.ac.uk/Geography/Html..._files/QI01.pdf
http://www.liv.ac.uk/Geography/Html...ac01.eps.pitt.edu/Courses/G..._Brook_2001.pdf
[url="http://mac01.eps.pitt.edu/Courses/G..._Brook_2001.pdf"]http://mac01.eps.pitt.edu/Courses/G..._Brook_2001.pdf[/url]
http://mac01.eps.pitt.edu/Courses/G..._et_al_1999.pdf
http://www.ngdc.noaa.gov/paleo/icecore/antarctica/vostok/vostok.html
http://news.bbc.co.uk/2/hi/science/nature/3792209.stm
 
Upvote 0

caravelair

Well-Known Member
Mar 22, 2004
2,107
77
46
✟25,119.00
Faith
Atheist
i have posted this several times on this board, and as far as i know, not recieved a single response yet. it is from an essay i did for an undergrad zoology course.

claim: mutations can add "information" to the genome.


Since the information argument is considered by creationists to be quite important, and is quite commonly used, it therefore deserves special attention. Phillip E. Johnson is a professor of law, and author of well-known creationist books such as Darwin On Trial. In an interview with the Christian magazine Touchstone, Johnson commented on the argument in question:
“You have said there is no natural explanation for the rise of genetic information. How important is that question in the debate?

PJ: The Wedge of Truth is all about those issues. The scientific key is, "No natural processes create genetic information." As soon as we get that out, there’s only one way the debate can go because Darwinists aren’t going to come up with a mechanism… Once you get that in the debate, then we will be poised for a metaphysical and intellectual reversal that is every bit as profound as the one with Copernicus.” (5).

Clearly, the argument is one worth addressing. Either it says something very important, or it is misleading those who think it does.
Before addressing the argument, it is important to understand exactly what it implies. It would not refute common descent, because the case for common descent is independent of any specific mechanism. That is, the evidence in support of common descent does not assume the validity of mutation and natural selection as a mechanism for that change (15). Furthermore, the inability to gain information would not prevent all types of macroevolutionary change. For example, it is unclear that the information content of other mammals’ genomes is any less than that of our own. So even if we assume mutations cannot add information to the genome, mutation and natural selection would not be prevented from successfully explaining macroevolutionary changes such as that from early apes to modern humans. So what would the argument tell us, if it were indeed correct? Information theorist David J.C. MacKay says “Evolution has been happening on earth for about the last 109 years. Undeniably, information has been acquired during this process.” (7: p269). This is something that is generally agreed upon. So what the argument would show, if it were correct, is that mutation and selection could never sufficiently account for the descent of all modern species from a common ancestor.
It should be noted at this point, that it is not at all necessary to consider “information” to examine the change of genomic properties in question. What we’re really talking about here is how the complexity of the genome can change. In an article published in Science called The Origins of Genome Complexity,
“The ~100 fully sequenced eubacterial and archaeal genomes contain between 350 and 6000 genes, packed into 0.6 to 7.6 megabases (Mb)… all well-characterized genomes of animals and plants contain more than 13,000 genes in at least 100Mb… Accompanying the increase in gene number in multicellular species is an expansion in the size and number of intragenic spacers (introns) and a dramatic proliferation of mobile genetic elements.” (3: p1401).

No one is claiming this list to be exhaustive of the differences in genomes, but it is interesting to note that these types of changes do indeed occur.
There are a few ways that gene number can be increased, including “Molecular mechanisms such as illegitimate recombination and LINE element mediated 3' transduction underlying exon shuffling” (6). Another mechanism is duplication mutation. It is estimated that 15,000 of the 40,000 genes in the human genome were acquired in this way (12). In this type of mutation, we get a second copy of some functional gene. Although this new gene will initially be the same as the gene it was copied from, “Preservation of both members of a duplicate pair can be promoted when one member of the pair acquires a beneficial mutation at the expense of an original essential function retained by the other (neofunctionalization).” (3: p1401). So, subsequent mutation of the new gene can result in a novel gene, while preserving the increased total number of genes. For example, from the pancreatic ribonuclease gene (RNASE1) in a leaf-eating monkey, a duplication and subsequent mutation resulted in a second gene (RNASE1B), which functions differently than its parent gene (11). Other examples abound in the primary literature, as an online search of the PubMed database will show.
Introns are non-coding sections of DNA that occur within a gene. Introns are found between exons, which code for functional domains of the protein corresponding to the gene. The size of an intron can be increased by an insertion mutation. Introns are non-coding, so changing an intron in this way may not affect the protein produced by the gene at all. There is not much certainty about how new introns are introduced, but among other theories, there is evidence for the insertion of new introns in certain genes. For example, there is evidence for the insertion of an intron into the sex-determining gene, SRY, of dasyurid marsupials. The scientists who determined this say “[their] data demonstrate that introns may be inserted as spliced units within a developmentally crucial gene without disrupting its function.” (10: p1653). The total number of introns in the genome can also be increased by duplication of genes with introns.
It is also interesting to note that a multicellular form of the green alga, Chlorella vulgaris, has evolved in the lab from the usual unicellular form (2).
So we have seen specific examples of the type of change that occurred during the evolution of modern species from our prokaryotic ancestors. We will now examine whether information theory has any implications for this problem.
By this point, an important question should be coming to mind. What is “information”, exactly? The intuitive meaning is obvious, but to talk about changes in information content, we need a formal, quantifiable definition. This question deserves special attention, because the validity of the information argument is dependant on how we define information. Unfortunately, our question has no simple answer. The information content of something depends on how information is defined, and there is no one right way to do that. A definition may be useful in answering one question, but meaningless to another. In his book Information Theory, Inference, and Learning Algorithms, MacKay poses the question of why some organisms reproduce sexually, rather than asexually. By MacKay’s model, asexually reproducing populations can gain 1 bit of information per generation, while the number of bits that a sexually reproducing population can accumulate is up to the square root of the size of the genome (7: p269). However, creationists are unlikely to define information the way MacKay did in his example.
Unfortunately, most creationists use the term “information” without explicitly stating what information is. This is often the main strength of the information argument for creationists. Without a formal definition of information, we can’t really say what type of change in the genome would represent increased information and in turn, it is then difficult to provide an example of such a change by mutation. One should be weary of any argument involving “information” content where the term is not explicitly defined.
Even without a strict definition of information, something can be said about the information argument. There is no shortage of creationist claims that certain mutations represent a loss of information. This exposes a problem with the information argument, because for any mutation, the opposite mutation is also possible, and in many cases, equally likely. So if a mutation can result in a loss of information, then surely the opposite mutation would mean a gain of information; if information can be lost, it can certainly be gained as well.
Dr. Lee Spetner has been more cooperative than other creationists in defining information. In an online exchange with Dr. Edward E. Max, Spetner says “I thought it rather obvious that a mutation that destroys the functionality of a gene (such as a repressor gene) is a loss of information. I also thought it rather obvious that a mutation that reduces the specificity of an enzyme is also a loss of information.” (13). This gives us an idea of what is considered to be a gain of information. If the loss of gene functionality is a loss of information, surely gaining a new functional gene would be a gain of information. An example of this has already been provided, but there are others that are of interest. For example, a frame shift mutation in a Japanese bacterium gave it the ability to digest nylon waste (16). Since the bacteria did not previously have this ability, this is a new biological function, and thus represents an increase in information. Spetner agrees, but contends that the mutation was not a random occurrence (14). Creationist organization Answers in Genesis claims that because the gene is on a plasmid, it has likely always existed, and was just transferred to the bacteria from another strain (1). However, nylon is an artificial compound that did not exist until it was invented in the 30’s, and bacteria with the gene require nylon to survive. The gene, therefore, could not have existed before the 30’s. This example is especially interesting in that the nylon digesting ability has given these bacteria an entirely new ecological niche to inhabit. One in which they have no competition but each other!
A well-known, good example of increased protein specificity is the evolution of a mutant version of a protein called Apolipoprotein AI (Apo-AI) in a small Italian community. The new version of the protein, Apo-AIM (the M is for Milano) is associated with reduced risk of arteriosclerosis, heart attack, and stroke.
“Apo-AI is a lipid-binding protein and is the major component of High Density Lipoprotein (HDL) particles, which play an important role in removing cholesterol from cells. Subsequent detailed research of the Apo-AIM mutation has demonstrated that it has improved biological function that directly contributes to lowering the incidence of cardiovascular disease in the individuals carrying it.” (8).

It works by actively stimulating cholesterol removal from cells (8). It also prevents some of the inflammatory damage of arteriosclerosis because of its antioxidant ability (8). Incidentally, the antioxidant ability is a new biological function, not possessed by the original Apo-AI protein (8). It has been shown that “Apo-AIM is 1) of a more complex tertiary structure 2) more stable and 3) activates cholesterol efflux more effectively than Apo-AI. Furthermore, Apo-AIM has an antioxidant activity not present in Apo-AI that is sequence and substrate specific.” (8). The mutation therefore represents increased specificity, and consequently is an increase in information by Spetner’s standards.


(1) Answers in Genesis. “That depends on what your definition of ‘information’ is”. Answers in Genesis. [Online]. Available: http://www.answersingenesis.org/home/area/feedback/negative7-24-2000.asp, Jan. 12, 2004.

(2) Boraas, Martin E. and Boxhorn, Joseph E. and Seale, Dianne B. 1998. “Phagotrophy by a flagellate selects for colonial prey: A possible origin of multicellularity”. Evolutionary Ecology. 12 (2): 153-164. Also available online: http://www.kluweronline.com/oasis.htm/171545, Jan. 12, 2004.

(3) Conery, John S. and Lynch, Michael. 2003. “The Origins of Genome Complexity”. Science. 302: 1401-04.

(4) Isaak, Mark. Ed. “Index to Creationist Claims”. The Talk.Origins Archive. 2003. [Online]. Available: http://www.talkorigins.org/indexcc/CA/CA111.html, Jan. 12, 2004.

(5) Interview with Phillip E. Johnson. Touchstone Magazine. 2002. Available online:
http://www.touchstonemag.com/docs/issues/15.5docs/15-5pg40.html


(6) Long, M. 2001. “Evolution of Novel Genes”. Current Opinion in Genetics & Development. Dec. 11(6): 673-80. Reproduced in PubMed. [Online]. Available: http://www.ncbi.nlm.nih.gov/entrez/...ve&db=PubMed&list_uids=11682312&dopt=Abstract, Jan. 12, 2004.

(7) MacKay, David J.C. Information Theory, Inference, and Learning Algorithms. Cambridge University Press, 2003. Also available online: http://www.cs.toronto.edu/~mackay/itprnn/book.pdf.

(8) Musgrave, Ian, and Pirie-Shepherd, Steven, and Theobald, Douglas. 2003. “Apolipoprotein AI Mutations and Information”. The Talk.Origins Archive. [Online]. Available: http://www.talkorigins.org/faqs/information/apolipoprotein.html, Jan. 12, 2004.

(9) National Center for Science Education. “Voices for Evolution” National Center for Science Education. [Online]. Available: http://www.ncseweb.org/article.asp?category=2, Jan. 12, 2004.

(10) Nei, Masatoshi. Ed. “De novo insertion of an intron into the mammalian sex determining gene, SRY”. Proceedings of the National Academy of Sciences of the USA. 1998 February 17; 95 (4): 1653–1657. [Online]. Available: http://www.ncbi.nlm.nih.gov/entrez/query.fcgi?cmd=Retrieve&db=PubMed&list_uids=9465071&dopt=Abstract, Jan. 12, 2004.

(11) Rosenberg, Helene F. and Zhang, Jianzhi and Zhang, Ya-ping. “Adaptive evolution of a duplicated pancreatic ribonuclease gene in a leaf-eating monkey”. Nature. 30 no. 4: 411-415. [Online]. Available: http://www.nature.com/cgi-taf/DynaPage.taf?file=/ng/journal/v30/n4/abs/ng852.html, Jan. 12, 2004.

(12) Ross-Flannigan, Nancy. Ed. “How gene duplication helps in adapting to changing environments”. University of Michigan News and Information Services. [Online]. Available: http://www.umich.edu/~newsinfo/Releases/2002/Feb02/r022802b.html, Jan. 12, 2004.

(13) Spetner, Lee. “Lee Spetner/Edward Max Dialogue”. The True.Origins Archive. [Online]. 2002. Available: http://www.trueorigins.org/spetner2.asp, Jan. 12, 2004.

(14) Spetner, Lee. “The Nylon Bug”. [Online]. 2002. Available: http://members.tripod.com/aslodge/id89.htm, Jan. 12, 2004.

(15) Theobald, Douglas, PhD. “29+ Evidences for Macroevolution: The Scientific Case for Common Descent”. The Talk.Origins Archive. [Online] http://www.talkorigins.org/faqs/comdesc/, Jan. 12, 2004.

(16) Thomas, Dave. “Evolution and Information”. New Mexicans for Science and Reason. [Online]. Available http://www.nmsr.org/nylon.htm, Jan. 12, 2004.
 
  • Like
Reactions: USincognito
Upvote 0
J

Jet Black

Guest
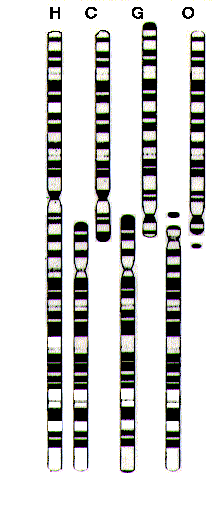
(1) Chromosome Banding Patterns

Here is Human Chromosome 2, alongside Chimp, Gorilla and Orang-Utan 2p,2q

hum_ape_chrom_2.gif


you can see there that the banding patterns are all pretty much the same. one major difference of course if that the other apes have 2 chromosomes there, whereas humans only have 1. However when we examine the human chromosome in more detail (which you can't from those diagrams) you find that in the centre of the human chromosome we have telomere like structures, which normally exist only at the ends of chromosomes. telomeres are a bit like the cellular lifetime counter, and a bit is lost on each cellular reproduction (with the exception of sex cells and cancer, which repair their telomeres) so if a telomere is '=' and a centromere is '8' (that is the bit of the chromosome containing the genes and so on) then the chimp, gorilla and orang utan 2p and q would look like ===888=== and ===888=== but the human 2 looks like ===888====888=== and you can still see this now in humans.

Telomeres are highly conserved sequences, which are primarily the same between all organisms in a group, for example all vertebrates have TTAGGG repeating over and over. In primates, between 300-5000 times. Ajacent to these regions are other regions of repeats called pre-telometric regions, which are highly variable, and vary significantly even within a species, but can be recognised between members of a species and closely related species.

In Humans, further evidence for a chromosome fusion, the order of these sequences (in the middle of the chromosome between the two centromere sections)

pretelomeric sequence, a telomeric sequence, an inverted telomeric sequence and an inverted pretelomeric sequence. so even these features are conserved.

note that only the 2p centromere functions now. the centromere of 2q, while remaining very clear that it was a functioning centromere, is no longer the point where the two chromatids join dusing cellular reproduction.


This sort of analysis is not limited to chromosome 2, but can be applied to the entire karyotype:

YunisFig2.GIF


The above image is just of humans and chimps.


(2) Endogenous Retroviral Sequences.

Retroviruses are a class of viruses that have their genetic material in the form of RNA and consist of groups such as the oncoviruses (e.g. HTLV-1) and lentiviruses (e.g. HIV). Normally DNA is transcribed into RNA before being read in order to produce proteins, however retroviruses use Reverse Transcriptase in order to take their own RNA and integrate it into the organisms own DNA. Like all genetic processes however, there is a risk of inaccuracy, and sometimes a retrovirus may become crippled by a mutation during reverse transcription, and hence may not be able to reproduce itself as a normal virus would.

Endogenous retroviruses may embed themselves into any cell in the body, and this includes the sex cells (gametes) as well as the normal body (or somatic) cells. If an ERV occurs in a sex cell that goes on to fertilise an egg (or be fertilised by a sperm) then the ERV will be present in every single cell of the new organism, including it's sex cells (well since it will be in one chromosome, initially it will only be in 50% of the sex cells).

Now one of the most important theories within evolution is that of random genetic drift, and this is an element of evolution that was only understood after the discovery of DNA. Genetic drift is a stochastic (statistical definition) process in which a particular allele (version of a gene), or bit of the DNA, will randomly increase and decrease in presence in the population, provided there is no selection pressure on that particlar allele or section of the DNA, and eventually it may become fixed within the population i.e. when it is present in all members of the population. This may happen to an ERV which became embedded within one particular individual; via random genetic drift it may become embedded in the whole breeding population. This occurs more rapidly in smaller breeding groups than large breeding groups.

The next step is the consideration of ancestry. If we have a group A, all of whose members have a particular ERV, we will call this ERV 'E1', and this group splits into 2 new groups, B and C, perhaps by a river forming in the middle of the group across which none of the organisms can cross, now both groups B and C will still have this ERV in all members. Now let us say that a new ERV is introduced into a member of group B and becomes fixed in group B. all members of group B will have this new ERV, which we will call 'E2'. now when we look at populations B and C, we see that B has both E1 and E2, and C has only E1. this means that E2 was introduced to the population B after B and C became separated. If B furter splits into Bi and Bii and Bii has a new ERV 'E3' fixed within its poulation, we find that Bi has E1 and E2, Bii has E1 E2 and E3 and population C still only has E1, so we can build up a tree of what order these different groups broke apart. An important point to note, is that we should never find a retrovirus shared between, for example, Bii and C alone, since the common ancestral group between Bii and C is the same common ancestral group with Bi: if an ERV becomes fixed in A, then all of its ancestors should have the ERV.

By examining ERVs, we can look at ancestral links between these populations. if we look at the presence of retroviruses within a population we can find when a particular group broke away from a different group due to the presence of the retroviruses within the group.

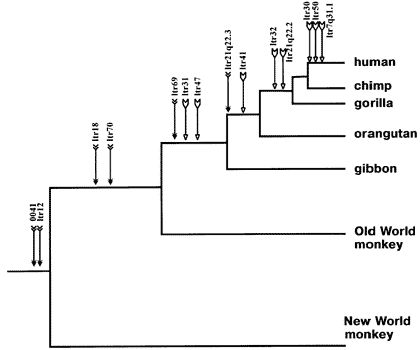
here is a chart of ERV distributions in the primates, and the phylogenetic tree constructed from it

retrovirus.gif


the above diagram is from the following paper:

Lebedev, Y. B., Belonovitch, O. S., Zybrova, N. V, Khil, P. P., Kurdyukov, S. G., Vinogradova, T. V., Hunsmann, G., and Sverdlov, E. D. (2000) "Differences in HERV-K LTR insertions in orthologous loci of humans and great apes." Gene 247: 265-277.

also we have

gkg496f3.gif


fig 3: Results of the 12 chimeric retrogenes insertional polymorphism study. The chimeras’ integration times were estimated according to the presence/ absence of the inserts in genomic DNAs of different primate species.

Note that u3-L1;Ap004289 is a polymorphism within the human species -- it integrated since the LCA of humans.

Ref: Buzdin A, et al. The human genome contains many types of chimeric retrogenes generated through in vivo RNA recombination. Nucleic Acids Res. 2003 Aug 1;31(15):4385-90.


A common creationist objection to the ERV concept is that of multiple insertions i.e. the idea that a virus might insert itself into the same place in different organisms and it becomes embedded in both organisms i.e. a human might be infected with E1, and this ERV becomes embedded in the human population, and a chimp might become infected with E1 and this also becomes embedded, however there are multiple problems with this hypothesis.

First and foremost, Of a genome that is 6 billion bases long, what are the odds that a ERV will be inserted into the same place? 1 in a 6 billion, right? Now, if there are 2 such ERVs, the odds are 1 in 6 billion times 1 in 6 billion for both being inserted into the same places by chance. If there are 3, you must multiply by another 1 in 6 billion. Now, since you have 12 such insertions in humans compared to the common ancestor, you have just passed the creationist number for it having occured by chance! By creationism's own criterion, their argument is invalid. The only creationist rebuttal to this is that there are hot spots, where the odds of a virus being inserted are slightly higher than other places, but there are still a great number of hotspots throughout the genomes, and given the above points, there is no reason why multiple infections would result in the same ERVs being inserted in the same locations with the same crippling errors and showing the same pattern of change with time. Again if there are multiple hotspots and multiple infections, there is no reason that there should not be ERVs that do not match the phylogenetic tree. again we see no deviances from expected inheritance patterns.

Secondly, there is no good reason as to why this would form the phylogenetic tree that it does. Even if there was a virus that was simultaneously capable of infecting every kind of primate from new world monkeys through to humans, there is no reason to think that this virus would actually infect every available primate and become fixed in every single population. we might well expect several to be missed i.e. we might see spider monkeys, bonobos, chimps and humans infected, but not gorillas or Orang Utan. we do not find these spurious distributions of ERVs.

Thirdly, we just do not find these sorts of retroviruses that have such a wide species affinity. and again, even if we did, there is no reason that the retroviruses would form the phylogenies that they do.

Fourthly, the retroviruses are crippled, but still identifiable as retroviruses. the retroviruses that we see in different species are crippled in the same way. If the retroviruses are the result of multiple infections, then there is no reason to expect the retroviruses to be crippled in the same way in different species.

Finally, additional alterations have been made to the ERV sequences over time. Since the ERVs themselves are not selected for or against, they themselves may be altered due to the same kind of genetic drift that caused them to be embedded within the population. we see inheritance of these changes too, that also match the phylogenetic tree of the presence of different ERVs.


Other Phylogenetic trees can be constructed in similar fashions by looking at ALU sequences (long sequences of repeating DNA) and transposons (kind of like internal viruses that only ever exist within the nucleus and copy themselves around the DNA)

(3) Transposons.

I will be brief with transposons since most of what needs to be said has already been said in the ERV section. Transposons are a form of internuclear parasite; they are sections of the genome that can copy and paste themselves around the rest of the genome. Again these transposons may become fixed within the population, and form the same sorts of phylogenetic profiles as ERVs. transposons are however completely independent from ERVs and function with a different mechanism (i.e. they do not use reverse transcriptase, they do not have viral coat proteins and they cannot cross cellular boundaries). The only possible mechanism of infection of another organism is via germ line cells - you may infect your children in other words, but nobody else. In this case there is absolutely no possibility for multiple insertions. The same phylogenetic trees can be constructed from independent analysis of transposons. It is these transposons which are responsible for much of the intergenic DNA and are also used in DNA fingerprinting, since cutting of certain chunks of DNA results in the same patterns for a given individual.
 
Upvote 0
J

Jet Black

Guest
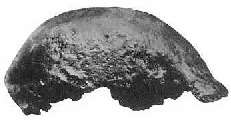
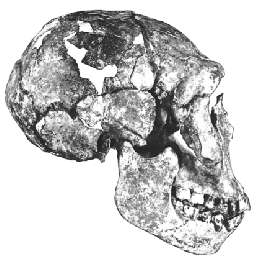
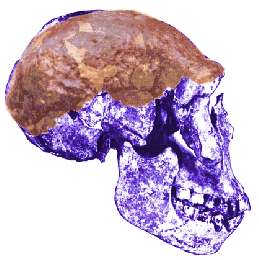
Creationists often make many claims about the human or ape nature of certain fossils, suggesting that particular fossils are just "funny looking chimpanzees" or "strange apes" or "deformed old men". However, rather ironically, the creationists often do not even agree over whether a particular fossil is human or ape. While it is perfectly natural for evolutionary scientists to disagree due to the gradiated nature of evolution, it is difficult to see how this should be the case for Creationists - surely it should be abundantly clear that a particular fossil is human or not. Disagreements between different creationist groups aside, here is a particularly interesting case where a creationist cannot even really agree with himself, never mind anyone else:

This particular disagreement is over the Java Man and Turkana Boy fossils, both of which are classified by modern scientists as Homo erectus. Duane Gish

This is Duane Gish, in 1993 talking about Java man:


"Now we can see the skullcap is very apelike. Notice that it has no forehead, it's very flat, very typical of the ape. Notice the massive eyebrow ridges, very typical of the ape" ...


here is a pic of the Java man skullcap

java_med.jpg


now he talks about Turkana Boy:


...the features of the Nariokotome juvenile were remarkably human with few exceptions." (Gish 1995)


here is a picture of the Turkana boy skull.

15000_med.jpg


now this is interesting. what happens if we overlay the two?

overlay1.jpg


what an astounding coincidence. and yet Gish still claims that Java Man is an Ape and Turkana is human. Here is a human skull (diagram)

sapiens.gif


now we can see here rather alot of differences, just simply from looking. the volume of the human cranium is significantly larger. The set of the teeth and jaw are much different. The face in the human is not as "pushed forwards". Gish claims that the only difference between H. Sapiens and Turkana boy is in the skull capacity and postcranial region and this is simply not true.


Gish D.T. (1993): The "missing links" are still missing (part 2). Science, Scripture and Salvation (ICR radio show) Sep 18, 1993. Gish D.T. (1995). Evolution: the fossils still say no! El Cajon, CA: Institute for Creation Research. (an updated version of Gish 1985)

update: In the following document, page 6 #3, Morris et al claim that Java man was a gibbon skull with a human femur

http://www.creationevidence.org/youth_conf/youth.pdf

so was java man a gibbon?

gibbonjava.jpg


on the left is a gibbon skull, and on the right is the Java man skullcap (which we have already demonstrated to be Homo Erectus)

so where did this come from?

well it was extracted from his 1934 and 1937 papers on the topic, however one can see that he is not saying that it is a gibbon, but in a genus allied to gibbons.

"Pithecanthropus [Java Man] was not a man, but a gigantic genus allied to the gibbons, however superior to the gibbons on account of its exceedingly large brain volume and distinguished at the same time by its faculty of assuming an erect attitude and gait [2]. It had the double cephalization [ratio of brain size to body size] of the anthropoid apes in general and half that of man."

"It was the surprising volume of the brain - which is very much too large for an anthropoid ape, and which is small compared with the average, though not smaller than the smallest human brain - that led to the now almost general view that the "Ape Man" of Trinil, Java was really a primitive Man. Morphologically, however, the calvaria [skullcap] closely resembles that of anthropoid apes, especially the gibbon."

"... I still believe, now more firmly than ever, that the Pithecanthropus of Trinil is the real 'missing link'."

"E. Dubois: On the gibbon-like appearance of Pithecanthropus erectus. While possessing many gibbon-like characteristics, P. erectus fills the previously vacant place between the Anthropomorphae and man as regards cephalic coefficient. (Amsterdam Royal Acad., Proc 38, No 6, June 1935)". (Reported in Nature, 136:234, Aug 10 1935)

and to quote his 1938 paper

I never imagined Pithecanthropus as a 'giant Hylobates' [gibbon], only as a giant descendant from a 'generalized' form, which had inherited from its ancestor, the 'gibbonlike appearance', but had ... doubled [its] cephalization ... (Dubois 1938, quoted in Shipman 2001)

in other words, he is not saying it is a gibbon at all, and not denying its link with humans.

more misrepresentation.
 
Upvote 0
The geolgical implications of a recent global deluge have always fascinated me. Here is one reason why:

There is a special type of rock formed in riverbeds or, for instance, in floods. This type of rock is known as conglomerate.

Now, conglomerate rock experiences a version of sorting -- that is, there is a gradient of grain size with larger grains (boulders) on bottom, going up through smaller grains on top (silt). However, this is all still one layer. There is blending and mixing. This is what we expect from a flood, but we do not see this in the geological column. What we see is something like this:

Sandstone
Siltstone
Shale
Coal
Congolmerate
Fine-grained Sandstone
Limestone
Congolmerate
Pre-Cambrian Metamorphic

This would indicate a (varied) marine regression, not a transgression. Also, each of these layers would be clearly marked -- you would go from one to the other in the space of a few centimeters. There is little to no mixing.

A visual:

14DSCN1792-base-of-Castle-Rock%20Conglomerate.jpg


That is an ancient riverbed. You can even see the sloping sides that were cut open when a canyon was carved across the old riverbed. Observe the huge boulders on the bottom. Now, a closer image:

sedDianeconglomerate2.jpg


See that, in just a few feet, you have a steady gradient from large rocks to pebbles, and then finer grains. This is what we see in flood plains and riverbeds.

On the stratigraphic column as a whole, though, grain sizes can do this:

Medium
Very fine
Fine
Mesh
Congolmerate
Medium Fine
Microscopic
Congolmerate
Pre-Cambrian Metamorphic

With rapid changes and back-and-forth fluctuations between very fine grains, fine grains, coarse grains, and back to microscopic grains in only a hundred feet, something that simply does not occur during a flood.

On top of all this, the whole concept of flood stratigraphy is off. We can find in some canyons places where the river cut across a pre-existing fossilized riverbed, and we can see where the ancient, bi-sected river is on one side and find it on the other. If the canyon was formed during a global deluge, when was the pre-existing riverbed formed and fossilized?

Let me give you a better visual than my blathering:
riverbed.bmp

We have two images here. I'll talk about the top one first.

This shows the stratigraphy (layers) of an fossilized riverbed and its surroundings. The black to light-grey sequence of the bed relates to the coarseness of the grains we see inside one, solid rock (conglomerate). I should add that the boundaries would not be that definite; the layers of grey would mix a bit but still keep the same gradient.

Around it, the other shades of red indicate varying types of sedimentary rock, most likely sandstone. This would be caused be a marine regression, where an ocean recedes leaving behind marsh, then rivers, then forests. Thus, the deep burgundy is limestone (oceanic rock), followed by coal and shales (marshlands). After that are the river(s), and the red around it would probably be coarse sandstone from flood washes of the river, especially in its shallower (lighter) stages.

After that is pink: shale and some more (less fertile) coal from a forest that took on the fertile land of the former river.

Each of these layers would be very distinct.

So far, we have a fossilized river inside a series of layers that indicate a marine regression, each one showing a different environment. Let me emphasize: a distinct, traceable river inside an entirely separate series of layers.

Now, to add to the conundrum, we have three different types of fossils found in the sandstones and shales on the distinct, observable riverbanks. (when I say distinct, I mean you can tell where the riverbanks had a cave in at some point. These are detailed.)

The blue streaks are footprints of a creature dependent on water, probably a predator that caught fish (why? Because those footprints do not appear later, when the river is shallower and no game would survive) equivalent to our modern crocodile or bear.

As the river got shallower, we find a new set of prints of a creature that probably came to the river to drink, as it was getting shallower and not much substantial game remained. Examination of the sandstone layers for environmental traces would confirm or refute this. The creatures lived in the floodplain and early forest, like our modern deer.

Finally, in the forest environment, the river is pretty much entirely dried up. On top of it, we have a new set of footprints: an animal that was at home in the groundlevel of the forest, but not around rivers.

Follow so far? Good.

Now, the second image. We have this ancient riverbed that we would never have found had a canyon not cut through it, exposing it. In this image, you can see the riverbed and the canyon. The red indicates where you can see the riverbed on both sides of the canyon.

This is the old-earth, evolutionist's interpretation. All the simple facts from the picture are in bold, with an intepretation based on evidence not in bold. If you have an alternate intepretation of the bolded facts that is explained by a global deluge, please let me know.

One more item: the extrapolation on the footprints is extreme at best, and highly un-scientific, since no images of the prints nor the fossilized environment were given. If you intend to interpret it otherwise, feel free to call the prints whatever you will, as long as they are three separate types of prints.
 
Upvote 0
J

Jet Black

Guest
A discussion of carbon dating is indeed rather interesting especially given the large amounts of correlating chronologies that can be generated using this technique. I will address these later, but first it is required to know a bit about how carbon dating works and where the carbon comes from in order to fully understand it and avoid any misconceptions

(1) Introduction to the Elements and Radioactivity.


All atoms are made of protons, neutrons (collectively called nucleons) and electrons, with the exception of Hydrogen which consists only of a single proton and an electron. We determine the element of an atom by counting the number of protons that it has. Elements may have different numbers of neutrons, and these are called isotopes. For example, Hydrogen has two additional isotopes called deuterium and tritium which have one and two neutrons respectively. Deuterium and Tritium are unusual in that these isotopes have names, most are identified by a number alone. for example c14 or U235 for Carbon with 14 neutrons or Uranium with 235 neutrons respectively.

An unstable atom is one which can decay to form a lighter atom, and the stability of atoms can be determined from the semi-empirical-mass-formula[1]

from this we can determine the binding energy of the nucleons in the nucleus. If the binding energy of the particular atom is higher than the binding energies of the lighter atoms, then that atom can decay to lighter atoms and emit energy. From this we can deduce the decay rate of an atom, or the time it is expected to live. Radioactive decays however are random, so we cannot give a lifetime to a specific atom, however we can derive the half life, or time that it would take on average for half the atoms in a sample to decay. The larger the sample of atoms, the more accurately we approach the half life in our measurements.

Going back to the SEMF once again, it is also possible to form atoms by adding energy and groups of nucleons, for example if we bombard a source of atoms with neutrons or high energy particles, sometimes those nucleons will stick together and make new atoms.

(2) The Origins of C14[2].

The carbon with which we are most familiar is C12, that is, 6 neutrons and 6 protons. C14 is an unstable isotope consisting of 8 neutrons and 6 protons, with a half life of 5730 years. there is another stable form of carbon called C13, that we will not address here, but is very useful for NMR scans. C14 is produced constantly in the upper atmosphere as a result of the interaction of nitrogen and cosmic rays in the following nuclear reaction:

N14 (proton -> neutron) C14

and decays back to nitrogen

Since it is being produced at a constant rate and decaying at a rate proportional to the amount of C14 eventually we will reach an equilibrium where the amount being produced is the same as the amount that is decaying and the concentration of c14 in the atmosphere remains constant. There will however be fluctiations since the solar wind is not constant, however we will look at this later.

(3) Misconceptions of C14 Dating.

There are a number of common misconceptions made when discussing C14 dating, and these will be covered in this section. The quantity of C14 is detected via dosimetry (for example using a geiger counter that detects atomic decays). One of the problems that this presents is that there are decay events occuring all the time, from materials naturally released by the earth through to fallout from nuclear weapons testing. The amount of background radiation around us varies depending on where one goes and is high in areas where there is alot of granite because of the Uranium content for example. Now when measuring a sample, this background radiation creates noise, which, if our sample only contains a tiny amount of C14, will wash out the radiation released from the sample; in short we simply cannot tell the difference between the radiation from the sample and the natural background. This limits the age of objects which we can date. A rough guide is 10 half lives, or in the case of C14, about 50,000 years. So C14 can only be used to date things up to around 50,000 years - it is useless for dating dinosaurs and so on, because there is not enough C14 in the fossils to detect, regardless of how old they actually are. so all we can say about such fossils is that they are over 50,000 years old.

From earlier we noted that C14 is produced in the atmosphere. well what about other carbon sources? well we know that there is lots of dissolved carbon in the sea, which originates from limestone and other ancient deposits. Now this carbon is all extremely ancient - often referred to as "dead" carbon as it contains little or no C14. So if anything gets their carbon from these sorts of sources, or is contaminated by these sources, then it will appear much older than it actually is. So for example we cannot date fish, seals, mussels, limpets and so on using C14, as their primary carbon source is the ocean, and hence dating them will make the organism look much older than it really is. You may have heard of freshly killed seals and mussels dated to several thousand years old - this is why. If you fed a seal on a primarily atmospherically derived carbon source, it would appear to be the right age. Contamination of samples can also be a problem, so if we preserve something in a carbon based preservative, then we will get a false age yet again - this has been observed in Mammoths preserved in formaldehyde and other preserving agents. Other interesting examples of problems can occur in underground nuclear sources which produce C14 in a similar way to atmospheric sources, so sometimes coal might be dated as under 50,000 years old if it is near a uranium deposit for example, since C14 will be produced from the radiation from the Uranium, again observation of the environment in which the material is found can eliminate these problems, since if you know there is contamination in some way, then you know your result is going to look strange.

I mentioned earlier that the amount of C14 under production in the upper atmosphere may change, and indeed it does. One criticism of C14 dating is that it relies on knowing how much C14 is produced, and of course nobody was measuring the Solar Wind 4000 years ago so how do we know how much was being produced. Maybe a lot less was being produced, making things look much older than they are, well we can test this also, and so I move on to the next section

(4) Correlating C14 Dates with independent measurements of age.

If the rate of C14 production changes, then how can we determine an age? We have to callibrate the amount of C14 according to the production rates, and this presents C14 dating with a problem, since one requires a well understood and accurate measure in order to determine how much C14 was produced in the first place. There are a number of available sources

(4a) Correlation with Tree Rings

There are a number of known trees which are thousands of years old and still alive. Each year, trees will deposit one layer of dead wood which makes up the trunk of the tree. The trunk's carbon source is atmospheric in nature and so will contain the sam proportions of C14 as the atmosphere, but once deposited, the wood is effectively "dead" and the C14 will decay out of equilibrium with the environment. Since we can see how old the tree is by looking at the numbers of rings, we can callibrate the amount of C14 and work out perturbations from the current value. We can match the amount of C14 in the living trees with dead trees and see where they overlap. Using this we can callibrate the C14 production rates back to about 9000 years or so. Occasionally there are additional rings or missed rings, however dendrochronologists can tell quite easily, and there is a tendency for missed rings rather than extra ones, and so trees are older than we think. Certain trees are less likely to miss or gain rings, and a knowledge of the trees can further improve accuracy.

(4b) Correlation with Lake Varves

Another type of seasonal deposition comes in the form of lake varves. In very calm lakes we find that there is a slow deposition of silt. In these lakes there also may be an abundance of algal and bacterial life living on the surface of the water (whose primary carbon source is atmospheric) which peaks during the summer and drops off during the winter. As these algae die, they also settle to the bottom of the lake. Since the silt is constantly being deposited and the dead organisms are periodic, then we see alternating dark and light bands. Each year, one of these bands is deposited, and these can form extremely thick layers consisting of thousands of bands. In the same way as the tree rings, we can analyse each of these bands and look at how much C14 is in them and correlate this with the number of bands. Using this technique we can correlate the amount of C14 in the atmosphere by tens of thousands of years (the most extreme perhaps is the Green River Formation in Wyoming, which has some 4,000,000 layers - these are all however too old for C14 dating). There are many of these sequences around the world, from Lake Sugietsu, Japan to Lake Gosciaz, Poland, The Cariaco Basin in Venezuela [3] lake Van in Turkey and others in Germany and Switzerland.

A criticism of this technique is that many varves may be deposited in a year. THe problem with that assertation is that this variation would have to be global in scale since we see correlation between the lakes all over the world.

pe05l.gif


The straight line is the assumption that C14 production rates have remained constant over the past few tens of thousands of years.

we see a slight drift from the C14 predicted dates and the predicted varve dates, due to the changing C14 production rate, but note that these variations correlate on a global scale - the graph includes points from Japan, Poland, Germany and Switzerland.

(4c) Correlation with Ice Cores[4]

Many polar regions are effectively deserts, seeing only a tiny amount of snowfall each year. During the summer months the snow is heated and melts slightly, and suring the winter it is deposited but not melted. Again this forms bands that are thousands of layers thick. Within this snow, bubbles of air containing a tiny sample of the atmosphere can be trapped. The Carbon in these bubbles can be analysed as normal, and the amount of C14 can be meaured. Since the layers are formed annually this can be callibrated with the amount of C14. As a slight aside, some of these ice cores are some three km thick, stretching back 740,000 years showing 8 ice ages which match with the obliquity cycle and the eccentricity cycle that occur every 41,000 and 100,000, confirming that these have a major impact on atmospheric conditions. So here we have ice cores matching up with astronomical evidence.


(5) Non C14 isotope dating.

As an additional note, there are a number of different types of radioisotope dating, using unstable elements other than C14, for which the lifetimes may be much longer. There are a number of methods of calculating the dates for these, from amount of material present through to ratios of parent and daughter products. Are there any alternate rulers to check these? Well these are much rarer, but here is one particularly exciting example.

Corals[5], much like trees, show varying deposition rates with the seasons. Corals are so sensitive however that we can study the weather at the time. In fact, to the extreme degree that corals have daily bands. and using these bands we can measure the length of the day when the corals were alive. A study of the earth shows that its rotation is slowing at 0.000015 sec per day and that during the Devonian period some 360-410 million years ago, the day would have been a mere 21.8 hours in length. Using thorium 230 and protactinium 231 radiometric methods we have dated corals to this time period, and an analysis of the coral structure indeed demonstrates that the day length was indeed much shorter. In this case we have a callibration between astronomical events and decay rates.[6][7]

(6) Summary

One Criticism of these techniques is whether the alternate "rulers" are themselves accurate. Tree rings are pretty much undoubtedly accurate, and errors tend to be minor, observable and make the trees look younger than they really are. There is Global Correlation of Lake Varve ages and Ice core Ages, and what is more, all three different techniques agree with one another to a high degree of accuracy. The three, totally independent alternate "rulers" agree in terms of their C14 content, and all agree in terms of the fluctuations in C14 production rates over the entire useful lifetime of C14. While there may be criticisms of a particular technique, to date I have never seen a good criticism of the global and multi technique correlation of independent dating techniques.

(7) References and Bibliography

[1] Discussion of Semi-Empirical Mass Formula http://www.phy.uct.ac.za/courses/phy300w/np/ch1/node22.html

[2]http://www.rlaha.ox.ac.uk/orau/sources.html

[3]http://www.ngdc.noaa.gov/paleo/pubs/hughen1998/cariaco.html

[4] http://www.ngdc.noaa.gov/paleo/icecore/antarctica/vostok/vostok.html

[5]http://freepages.genealogy.rootsweb.com/~springport/geology/coral_growth.html

[6]Laurent Augustin, et al., “Eight Glacial Cycles from an Antarctic Ice Core,” Nature 429 (2004), 623-628.

[7]Jerry F. McManus, “A Great Grand-Daddy of Ice Cores,” Nature 429 (2004), 611-612.

nb: I may add a couple more graphs to this later.

 
Upvote 0

Lilandra

Princess-Majestrix
Dec 9, 2004
3,573
184
55
state of mind
Visit site
✟34,703.00
Faith
Pantheist
Marital Status
Private
Politics
US-Others
Hi,

Here is a post from a Creationist maybe to keep this thread from becoming unstuck. :wave:

Edit to add: I have since converted from OEC to TE but I will stil leave this here as an ID argument.

My understanding of Intelligent Design is that it posits that a lot of the natural world is too complex to have occurred by evolutionary mechanisms alone. They use scientific evidence of some of the intricacies of how natural things are made to conclude that it has the appearance that it is designed. Exactly who designed life varies to the individual IDer some think the Christian God, some an unnamed Higher Being, some speculate that it could have been intelligent aliens. (I think that explanation is weird)


Here is one example from an article about the Universal Genetic Code's resistance to harmful alterations (mutations) or error resistance. It is based on a study of the Code done by Princeton and the University of Bath (UK) They compared the natural genetic code's error resistance to randomly generated ones.

First an explanation of what they mean by the Universal code's error resistance.

[font=Verdana said:
Lily from a Fazale Rana article
[font=Verdana said:
[font=Verdana said:
Qualitative Design Evidence

The genetic code's redundancy appears to be well thought out rather than haphazard. Genetic code rules incorporate a design that allows the cell to avoid the harmful effects of substitution mutations. For example, six codons encode the amino acid leucine (Leu). If at a particular amino acid position in a polypeptide, Leu is encoded by 5' (pronounced five prime, a marker indicating the beginning of the codon). CUU, substitution mutations in the 3' position from U to C, A, or G produce three new codons, 5' CUC, 5' CUA, and 5' CUG, all of which code for Leu. The net effect produces no change in the amino acid sequence of the polypeptide. For this scenario, the cell successfully avoids the negative effects of a substitution mutation.

Likewise, a change of C in the 5' position to a U generates a new codon, 5'UUU, that specifies phenylalanine, an amino acid with similar physical and chemical properties to Leu. A change of C to an A or to a G produces codons that code for isoleucine and valine, respectively. These two amino acids also possess chemical and physical properties similar to leucine. Qualitatively, the genetic code appears constructed to minimize errors that result from substitution mutations.


What the study found about the code when compared to randomly generated code.


Lily from a Fazale Rana article said:
Quantitative Design Evidence

Recently, scientists from the University of Bath (U.K.) and from Princeton University worked to quantify the error-minimization capacity of the genetic code. Early work indicated that the naturally occurring genetic code withstands the potentially harmful effects of substitution mutations better than all but 0.02 percent (1 out of 5000) of randomly generated genetic codes with codon assignments different from the universal genetic code.16

This initial work overlooked the fact that some types of substitution mutations occur more frequently than others in nature. For example, an A-to-G substitution occurs more frequently than does either an A-to-C or an A-to-T mutation. When researchers incorporated this correction into their analysis, they discovered that the naturally occurring genetic code performed better than one million randomly generated genetic codes. They also found that the genetic code in nature resides near the global optimum for all possible genetic codes with respect to its error-minimization capacity.17 Nature's universal genetic code is truly one in a million—or better!

The genetic code's error-minimization properties are actually more dramatic than these results indicate. When researchers calculated the error-minimization capacity of one million randomly generated genetic codes, they discovered that the error-minimization values formed a distribution where the naturally occurring genetic code's capacity occurred outside the distribution.18 Researchers estimate the existence of 10 to the 18 possible genetic codes possessing the same type and degree of redundancy as the universal genetic code. All of these codes fall within the error-minimization distribution. This finding means that of 10 to the 18 possible genetic codes, few, if any, have an error-minimization capacity that approaches the code found universally in nature.

Obviously concerned about the implications, some researchers have challenged the optimality of the genetic code.19 The teams from Bath, Princeton, and elsewhere, however, have effectively responded to these challenges.20


*16 David Haig and Laurence D. Hurst, "A Quantitative Measure of Error Minimization in the Genetic Code," Journal of Molecular Evolution 33 (1991): 412-17


What the chances are for the code to have originated naturally

[size=1 said:
Lily from a Fazale Rana article
[size=1 said:
[size=1 said:
Even if the genetic code could change gradually over time to yield a set of rules that allowed for maximum error-minimization capacity, is there enough time for this process to occur? Biophysicist Hubert Yockey has addressed this question.23 He calculates that natural selection would have to explore 1.40 x 10 to the 70 different genetic codes to hit upon the universal genetic code found in nature. Yockey estimates the maximum time available for the code to originate as 6.3 x 10 to the 15 seconds. Put simply, natural selection lacks adequate time to find the universal genetic code. It would have to evaluate about 10 to the 54 codes per second.


http://www.reasons.org/resources/ff...iphering_design

First, I don't want to get sidetracked by the evolution doesn't address the universal code argument.

What ID would say about the results is that it is improbable for the code to have originated randomly and or naturally. Therefore it must have been designed.

That is a convincing argument to me others here may not be as convinced.

[/size][/font]
 
  • Like
Reactions: Oncedeceived
Upvote 0

caravelair

Well-Known Member
Mar 22, 2004
2,107
77
46
✟25,119.00
Faith
Atheist
i posted the following comments to another thread, and it was the last post to the thread. since it took my a while, i thought i would get some use out of it and post it in a new thread, since i think it addresses some of the misconceptions about science that many creationists on this board seem to have. i have edited the post to make it a more general discussion, since it was originally a response to a particular post. the main aim of this post is to address the creationist notion that creationists and scientists are just interpreting the evidence in different ways. for example, ken ham says...

They really don’t understand that it is not a matter of ‘their evidence vs ours.’ All evidence is actually interpreted, and all scientists actually have the same observations—the same data—available to them in principle.

but the thing is, evidence is not interpreted in science. whether or not a piece of data supports a theory is an objective thing. no sort of interpretation is involved at all...

Can we test gravity? yes, we can.

and we can also test evolution, in precisely the same way we test gravity.

We can drop a rock, and see that it falls to the ground. And every time we do this, the same thing happenes.

likewise, we can observe evolution occuring, both in the wild, and in the lab.

Although scientists don't know what it is yet, they know that it exists, and it can be tested.

well they have theories about how it works. specifically, general relativity is the current theory of how gravity works. we use the theory of general relativity to explain our observations of gravity. likewise we use the theory of evolution to explain our observations of evolution, and to explain our observations of the fossil record that show that species have greatly changed over time. and we test general relavity in the same way that we test the theory of evolution. general relativity makes predictions about how gravity works, and we can go and check if these predictions are correct or not. specifically, general relativity predicts that the path of light will be bent by gravity.

FG23_021.jpg


previously we did not expect light to be bent in quite the same way, because the newtonian theory of gravity made different predictions about how light would be affected. so if general relativity is right, then we should see that light is bent by gravity in the way general relativity predicts. since that prediction was made, we have been able to observe that the path of light IS indeed bent by gravity, in presicely the way we expected.

gravitational%20lensing%20on%20galaxy%20cluster%20abell%202218.jpg


and so this piece of information becomes evidence for general relativity.

that's what evidence is: verification of predictions of a theory. and if our predictions turn out to not be true, then the theory must not be true either. in other words, the theory is falsified. this is the form that all scientific evidence for any theory takes. interpretation is not a part of the process. when we have strong specific predictions from a theory, either the data does not match our predictions or it does. light is either bent by gravity, or it is not. no interpretation goes into determining whether or not this is the case.

so of course, the evidence for evolution is of the same form. evolution makes very strong and specific predictions about the way things must be, and you can read a great article about these predictions here:

http://www.talkorigins.org/faqs/comdesc/

if these predictions are found false, then evolution will be found false. but as you can see from the above article, evolution has a fantastic track record as far as it's predictions go. in fact, we have many more lines of evidence supporting evolution than we do supporting general relativity. yet you never see creationists arguing against gravity.

That is how science works!
When someone are trying to proove gravity, would they ever get the conclusion that God makes it happen? No, God is not an option in science!

it is true, science cannot say "god did it" about something. that is because we cannot test such an explanation, because as an explanation, it makes no predictions whatsoever about what we should find. because of this, any possible data we could ever find would be 100% consistent with this. so therefore we cannot have evidence for this type of theory, because it is impossible for us to be surprised that any data is consistent with our explanation. after all, it is impossible for data not to be consistent with our explanation. so science doesn't rule out the possibility that god was involved, it just can't be used to test the idea. 'last thursday-ism' is a good example to demonstrate why we can't test such an idea with science. i could claim that the entire universe was created last thursday, with the appearance of great age, and each of us created with false memories of our earlier lives that never actually happened. how could we test whether or not this explanation is true? we can't, because there's nothing we could ever find that could possibly contradict it. it is for the same reason that we cannot use science to test the claim 'goddidit', so we cannot have evidence for this.

that being said, there are some creationist models that do make predictions. YEC models include a global flood and a 6,000 year old earth, and falsifying evidence was found for both of these claims 200 years ago.

good theories in science are ones that are falsifiable, but we haven't been able to falsify them yet. all the creationists ideas i have heard so far have either been falsified, or were not falsifiable, and no amount of interpretation can change that fact. so creationism is not supported by science. evolution makes strong predictions, so it is falsifiable, and in 140 years it has not been falsified.
 
Upvote 0

MartinM

GondolierAce
Feb 9, 2003
4,215
258
44
Visit site
✟5,655.00
Faith
Atheist
Marital Status
Engaged
Can't believe this isn't here yet:

Captain_Jack_Sparrow said:
Earlier today on another thread our newest post and run Creationist 'evolutionbuster' trotted out the time honoured Hovindism about the Moon having been too close to the Earth in the past thus producing huge tides making life on the Earth presumably impossible. I challenged him to produce calculations supporting this nonsense. Of course (and at least he admitted this) he could not do so. But of course he was confident that his sources had this capability and thus the statement was legit.

So I, being bored this evening, decided to calculate this myself from first principles. Especially since he asked if I could provide calculations. Well here goes. (this does get a little involved and so I'm sure it will turn people off this thread but what the heck!)

The problem of calculating the Earth Moon separation as a function of time is not a trivial problem - as I discovered trying to calculate the bugger. Also let me state that this calculation I shall present is really only an approximation - a somewhat sophisticated one but an approximation nonetheless.

In fact the true Earth Moon separation history will forever remain unknown in an accurate manner. Any calculation of this has some fundamental limitations which I shall mention below. But a plausible calculation is possible.

Calculation

The aim is to derive a function describing the rate of change of the semi-major axis of the Moon's orbit as a function of time. The tides raised on the Earth by the Moon dissipate energy (from friction) due to tidal oscillations caused by the fact the Moon orbits in a different period than the Earth rotates. A corresponding phase shift of the Earth's tidal response thus ensues.

The simplest (on a Saturday evening) method of tackling this problem is to model the Earth's response as forced harmonic oscillator.

After about a page of algebra (omitted here because of the lack of typesetting for equations) the key result I get is that

sin(phase shift) = -1/Q.

Q is the dissipation function of the oscillator which should be recognised by physics undergrads.

Now the mean motion of the moon (denoted by n) is less than the Earth's angular velocity (W) therefore the tidal bulge is ahead of the Moon by an angle I = 2 x (phase shift).

Therefore (as I think most people know) the tidal bulge is not aligned with the Earth-Moon direction. This means a tidal torque exists and thus a transfer of energy and angular momentum exists between the Earth and the Moon.

We determine the torque T on the Moon by the usual

T=r X F where the X is the vector cross product.

And the Force F is determined by the gradient of the Earth's external potential V at the Moon's position.

Now only the component of the force orthogonal to the Earth-Moon direction contributes to the torque and only the second order dipole term of the Earth's potential contributes to the force component.

Now the work done by the torque increases the orbital energy of the system at the rate = T x n. By Newton's 3rd Law an equal and opposite torque acts at a rate T x W to decrease the rotational energy of the Earth. Since W > n then these rates are NOT equal and therefore the total mechanical energy of the Earth Moon system decreases at the rate = -T(W-n).

This energy goes into heating the Earth and of course determines the evolution of the Moon's orbit over time. This is what we want.

Thus by now applying an energy argument I can calculate the separation as a function of time.

Total Earth-Moon mechanical energy is :

E = (1/2 * I * W^2) + (-G M m/2 a) I= Earth moment of inertia M = Earth mass

m= Moon mass and a = semi major axis of Moon's orbit.

Therefore differentiating with respect to time:

E(dot) = I W W(dot) + 1/2 * (M * m /(M + m)) * n^2 * a * a(dot)

where (dot) means the time derivative. I used Kepler's 3rd law above.

Looking at the total system angular momentum we get:

L = I W + (M m /(M +m))* a^2 *n (and is conserved of course)

L(dot)=0 which implies I W(dot) = -1/2 * (M *m/(M+m)) *n a a(dot)

Putting this in the E(dot) expression gives us:

E(dot) = -1/2 * (M*m/(M+m)) * n a a(dot) (W-n).

Thus a increases while W decreases. As we observe currently for the Earth Moon system.

Now putting all this together and using the standard Newtonian tidal potential V = -3/5 R^4 (constant) g (1/r)^3 * P2(cos H).

R=Earth radius P2=second order Legendre polynomial r=Earth-Moon distance

we finally get that the a(dot) - which is our goal is:

(I have omitted quite a bit of algebra here and above in the V expression)

a(dot) = 3 (Love #) * (m/M) * R^5 *(a^-4) * n/Q and n=(G*M/a^3)^0.5

Now the Love # is a number based upon the elasticity of the Earth and I cheated (because I don't know how to calculate it) and found it's value is 0.3.

But the real problem for any calculation to proceed is the tidal dissipation function Q.

The current value is approx. 12. But this value depends on the position of the continents and the fact that the Earth's oceans are in near resonance with the Moon. That is the phase shift I mentioned at the start is a small angle. In the past when the Earth was rotating faster the value would have been higher.

This is where uncertainty crops up and I found a reference Webb (1982) paper in Geophysical Review of Royal Astron. Society that a mean value for the entire Earth's history is approx. 34.

Thus we can integrate the above a(dot) expression and find the a as a function of time.

This gives us (finally !!!!!!!!)

a(final)^6.5 - a(initial)^6.5 = 39*(0.3)*(G/M)^0.5 * R^5 * m * (Time)

where G=Newton Grav. constant.

Results

I wrote a quick C program to calculate this and some numbers kicked out are:

Current Moon a = 3.844 X 10^10 cm

Going back 1 billion years I get a = 3.698 X 10^10 cm
Going back 4 billion years I get a = 2.731 X 10^10 cm.

As we can see the Moon is nowhere near the Earth. Closer yes - but not that close. I have seen Creationists say that the Moon a billion years ago would be so close as to break up at the Roche limit which is only some 2 X 10^9 cm - what a joke!!!!

As for the height of the tides - I used the standard equlibrium calculation in any udergrad mechanics text.

Currently the Moon on average raises a tide of approx. 35 cm on the Earth. The Sun raises about 15 cm for comparison. So the current total is about 50 cm.

According to my calculations, 4 billion years ago the tide from the Moon would have been about (3.844/2.731)^3 = 2.78 times greater.

Thus the Moon would have produced a tide of about 100 cm (2.78*35) and the Sun's would have been the same as above for a total of 115 cm.

So this supposed doom of HUGE tides is typical Creationist bs. The total is just over twice the current level. Annoying for coastal areas but not Earth threatening.

All in all - another example of Creationst nonsense.


I realise this is way too much effort for a message board but heck it was kind of fun.
 
Upvote 0

Norseman

EAC Representative
Apr 29, 2004
4,706
256
22
Currently in China
✟28,677.00
Faith
Humanist
Marital Status
Private
Politics
US-Others
I'm posting this on behalf of Scigirl from IIDB, the following is her work:

http://www.gate.net/~rwms/hum_ape_chrom.html

Long long ago, in a laboratory far far away, scientists figured out that chimpanzees have 24 chromosomes in their sperms and eggs, whereas humans only have 23. Therefore, these great scientists theorized that two of our chromosomes might have fused together sometime in the recent past (aka million years ago.). Their theory made 3 predictions:

1) One of our chromosomes would look like two of the chimp chromosomes stuck together.
2) This same chromosome would have an extra sequence in it that looked like a centromere. Centromeres are the things in the middle that microtubules grab onto to divide a pair of chromosomes during mitosis.
3) It would also have telomeres (ends) but in the middle - and they would be in reverse order. Sort of like this:

ENDchromosomestuffDNEENDchromosomestuffDNE

See the "DNEEND" in the middle? That's what two telomeres would look like if two chromosomes were stuck together.

Lo and behold, these theories were put to the test. To test prediction 1, know that chromosomes all have a unique banding pattern. A "fingerprint." To test 2 and 3, you need sequence data. Telomeres and centromeres have characteristic DNA sequences.

What did those scientists find:


H=human, C=chimp, G=Gorilla, O=orangutan.

The second prediction - remnants of the 2p and 2q centromeres is documented in reference 4. The normal centromere found on human chromosome 2 lines up with the 2p chimp chromosome, and the remnants of the 2q chromosome is found at the expected location based upon the banding pattern.

and

Telomeres in humans have been shown to consist of head to tail repeats of the bases 5'TTAGGG running toward the end of the chromosome. Furthermore, there is a characteristic pattern of the base pairs in what is called the pre-telomeric region, the region just before the telomere. When the vicinity of chromosome 2 where the fusion is expected to occur (based on comparison to chimp chromosomes 2p and 2q) is examined, we see first sequences that are characteristic of the pre-telomeric region, then a section of telomeric sequences, and then another section of pre-telomeric sequences. Furthermore, in the telomeric section, it is observed that there is a point where instead of being arranged head to tail, the telomeric repeats suddenly reverse direction - becoming (CCCTAA)3' instead of 5'(TTAGGG), and the second pre-telomeric section is also the reverse of the first telomeric section. This pattern is precisely as predicted by a telomere to telomere fusion of the chimpanzee (ancestor) 2p and 2q chromosomes, and in precisely the expected location.

So how about it, non-evolutionists? Here, staring you in the face is not only evidence that chimps are our cousins but also a clue as to how it occured: two chromosomes fused, which could have altered gene expression in ways to change body plans.

Happy refuting!

scigirl
 
Upvote 0

Deamiter

I just follow Christ.
Nov 10, 2003
5,226
347
Visit site
✟40,025.00
Faith
Christian
Marital Status
Married
I just cleaned out some substandard and non-QT material posts. No big conspiracy, all deleted posts are now here.

It still bugs me a bit that only one creationist has posted here, but I'll reiterate that any well researched (and necessarily longer) post that presents a series of evidences may be posted here. I stickied this thread primarily to "save" those wonderfully worded OPs that so often get lost behind mountains of newer threads.
 
Upvote 0

grmorton

Senior Member
Sep 19, 2004
1,241
83
76
Spring TX formerly Beijing, China
Visit site
✟31,783.00
Faith
Non-Denom
Marital Status
Married
Karsts are due to cave collapse. Florida is a perfect example of a karsted terrain. Caves, carved out of the limestone by the movement of fresh rain water collapse and cause round sinkholes. Watching the sinkhole formation in Florida we know several things about it. It doesn’t occur every single day. We also know that it takes time to carve the caves out to the point that they will become structurally unstable. We also know that when a cave collapses, the sediment above it falls into the cave and forms a rubble. We also know that the sinkholes (karsts) are circular in shape.
What are we to think when we find karsts very deep in the geologic record with evidence that the collapse occurred during the middle of the geologic column?

The following is from B. A. Hardage et al, “3-D Seismic Evidence of the Effects of Carbonate Karst Collapse on Overlying Clastic Stratigraphy and Reservoir Compartmentalization,” Proc of the Nat. Gas Conference, Dept. of Energy, 1997
http://www.netl.doe.gov/publications/proceedings/97/97ng/ng97_pdf/NG4-1.PDF

The Ordovician Ellenburger Formation is a limestone and dolomite formation covering parts of West Texas. The dolomite is evidence of the time required to form the Ellenburger. Dolomite is a calcium-magnesium limestone. The Ellenburger is also oolitic (small round carbonate grains like those we see taking months to form today in the Bahamas), and it has small sponge bioherms (see Wilson 1986, p. 98). These two items show that it took time for the Ellenburger to be deposited. It simply couldn't have been dumped into place in a couple of days.

Within the YEC view this formation would be deposited by the flood. Shortly after the deposition of the Ellenberger it had to be lithified because there is an erosional unconformity at the top of the Ellenburger and below the next higher bed, the Simpson Formation.

But what is interesting, is the age of the dolomitization of the Ellenburger limestones. There are two views of dolomite, which is a calcium magnesium carbonate rather than a calcium carbonate. Some have argued that dolomite was laid down initially and other have argued that it was limestone first and then chemical reactions changed it to dolomite. There is support for this latter view in the case of the Ellenburger. Some of the limestone cobbles found in conglomerates of the Marathon fold belt in SW Texas (where the Haymond Formation is) clearly come from the Ellenburger, but they are all limestone. Wilson states:

"A related example is found in the Ordovician exotic boulders in the Marathon fold belt of West Texas. The blocks derived from the Lower Ordovician Ellenburger group are practically all limestone whereas the environmentally equivalent shelf facies is highly dolomitized. The best interpretation is that Ellenburger dolomitization occurred after the boulders were emplaced (i.e., in late Canadian and Middle Ordovician time during the formation of the widespread North American pre-Simpson unconformity)." J.L. Wilson, Carbonate Facies in Geologic History, (New York: Springer-Verlag, 1986), p. 317

Thus it appears that the Ellenburger was initially deposited as a carbonate and later changed to a dolomite. This too would take time because it means that pore waters must flow through the rock and change the calcium carbonate to calcium-magnesium carbonate. And this must occur over a vast area--i.e. most of Texas.


Another interesting item is that during the erosional interval, caves were formed in the Ellenburger. There was enough time for the caves to form speleothems, formations of limestone formed only in caves. Loucks writes:

"The initial brecciation and fracturing are well documented to be associated with cave formation and collapse. The collapse starts at the surface contemporaneous with cavern formation and continues into the subsurface to at least 9,000 ft of burial. Cave formation is evidenced by (1) detrital cave-sediment fill, (2) Upper Ordovician to Mississippian conodonts in the sediment fill, (3) speleothems, and (4) lateral extent of brecciated pods. Paleocave collapse is the origin of most Ellenburger brecciation and fracturing. Boxwork structure and higher temperature baroque dolomite cements are evidence of thermobaric brecciation. Boxwork structure is composed of closely spaced dolomite-filled fractures on the scale of decimeters to millimeters. The host is commonly dissolved, leaving an open boxwork. The baroque dolomite cements passively fill the void spaces created by cave processes. Tectonic fractures cut host rock, lithified breccias, and lithified sediment fill. They have relatively strong directional patterns. http://aapg.confex.com/aapg/sl2003/techprogram/paper_78591.htm

These caves had to be formed by freshwater flow. Marine waters are saturated with calcium carbonate and thus can't effect a net erosion of limestones required for cave formation. Stalactites and other dripstone speleothems simply won't form underwater. Thus, the Ellenburger would have had to have been above the waters of the global flood during the formation of the caves. This raises a question of how these beds, buried as deep as 11,000 feet today were above flood waters when they were eroded. These caves didn’t collapse for several million years. Below is a seismic line from the above article. It show the effect of the Ellenburger cave collapse on the sediments above. These vertical collapse structures are 2500 feet tall and the karsts on the right are 500 feet or so wide. The one to the left is probably 3000 feet wide.

karstcollapseEllenburgerSeismictw.jpg


The sequence of events is this: Ellenburger was deposited with enough time for oolites and sponge bioherms to form. Since it is impossible to deposit a hole in loose sediment, the Ellenburger had to lithify prior to the cave formation. Cobbles found in the Marathon Fold Belt show that the Ellenburger had lithified before the erosional event--something not expected in a global flood scenario. Then lots of fresh water flowed through the Ellenburger, carving out the caves. And there had to be time for the stalactites to be formed. But the caves didn’t collapse just then. The Ellenburger was then buried by younger sediment up to the Pennsylvanian aged Bend Conglomerates, of which, the Pennsylvanian Caddo is the uppermost member. These sediments then had to lithify because the cave breccia found in oil well cores taken from the collapse structures show angular cobbles of rocks from the overlying formations. Today the Caddo is 4800 feet deep in this area and it is 2500 feet above the Ellenburger. This means that the lithification of 2500 feet of strata had to occur prior to cave collapse. Then the cave collapsed causing a major and very deep sinkhole. The red arrow at about .8 seconds shows the level at which the sinkhole ceases affecting the sedimentation.

The 3D seismic shows that the sinkholes are vertical. The maps of these two members (Caddo and beneath it the Vineyard) are shown below. They show the circular collapse sinkholes (karsts) are vertically above each other on the structural maps. These two horizons are separated by 1000 feet of rock. This map is the upper surface, the Caddo:

karstCaddoSurfacetw.jpg


Compare this with the lower Vineyard structural map:

karstVineyardSurfacetw.jpg


Everything in these karsted terrains show that much time is needed to deposit the geologic column. The questions YECs need to ask themselves.

1.How long does it take to deposit the Cambrian rocks beneath the Ellenburger?
2.How long does it take for oolites and sponge bioherms to form?
3.How long did it take for the Ellenburger to lithify?
4.How long did it take for the erosional interval to deposit the Ellenburger limestone cobbles in the Marathon Fold belt?
5.How does freshwater flow through the Ellenburger, when it is a marine deposit and was supposedly deposited by marine waters of the global flood?
6.How long does it take for stalactites and stalagmites to be formed in the Ellenburger caves? How long does it take to erode the caves?
7.How long did it take for magnesium-rich pore waters to flow through the vast area of the western half of Texas to change the calcium carbonate Ellenburger into a calcium-magnesium carbonate we see today?
8.How long did it take for the sediments above the Ellenburger up to the Caddo to lithify?


Now my standard questions for the YECs to ask themselves.

YECs simply do not learn of these things in the YEC propaganda literature. By only reading YEC material, the young-earther only hears that which agrees with his world view. That is an assured method to only know half of the story. The many posts I have been presenting are telling you the part of the story that AIG simply ignores because they don’t want to listen either. I have shown the pictures of these features. What do you think is telling you the truth? The pictures or AiG and ICR which never publishes pictures like these?

Occasionally we hear of a sinkhole in Florida swallowing a house or draining a lake. This occurs because large parts of Florida are built upon limestone and limestone is eroded by fresh (not sea) water. In the case of Florida the fresh water is rainwater. Sinkholes only form when the limestone is above sea level. As water sinks into the lime, it dissolves it and creates a cave system. When the cave gets too close to the surface, the roof collapses creating a sinkhole. Any sediment or houses which were deposited or built on top of the cave, fall into the cave. (this is an important point for later on in this article) One can see a circular sinkhole in the very center of the photo below.


Now, the formation of a cave and a sinkhole takes a long time and lots of it. The reason is that fresh water won’t dissolve very much limestone. Russ Maatman wrote:

"But a cup of water dissolves only two ten-thousands
of an ounce of limestone." Russell Maatman's book, The Impact of Evolutionary Thought: A Christian Perspective. (Dordt College Press, 1993),p 55

This means that a gallon of water will dissolve only about .09952 gm of limestone per gallon. That is a very slow rate of dissolution. So, two things are important for the formation of sinkholes—freshwater meaning the rocks were above the oceanic waters and lots of time.

So, what are we to do when we find sinkholes(also known as karsts) buried deeply in the geologic record. If they were due to the flood, then we have to have the limestone bed uplifted above the flood waters for long enough time for rain to dissolve the limestone. Below is a picture from a 3D seismic from the Gippsland basin of Australia. The circular features are sinkholes/karsts. This is buried at approximately 5600 feet deep.(Modified from Brown, 1999, p. 101)
karsttw.jpg


If the sediments above and below this karsted layer were deposited by the global flood, how was there enough time to uplift the Gippsland basin, dissolve the lime, form caves and then have caves collapse forming the sink holes???

But this isn’t all that can happen with karsts, sinkholes and caves in the geologic column. On the SE edge of the Grand Canyon there is Cedar Mtn, which is formed out of Triassic strata. It is only a tiny outlier of the Triassic which once covered the entire Grand canyon area prior to the Canyon’s erosion. As one travels north from the northern rim of the Canyon, one can find the Canyon wall sediments being buried by Triassic and then the Triassic being buried by still younger strata in turn. Because of this Cedar Mtn outlier, we know that at least the Triassic strata covered the canyon and has now all been eroded away. (To move that much rock also requires considerable time).

The Mississippian Redwall limestone, which is one of the cliff forming units in the Grand Canyon we find ancient sinkholes.

"The breccia pipes formed as sedimentary strata collapsed into dissolution caverns in the underlying Mississippian Redwall Limestone. Upward stoping through the upper Paleozoic and lower Mesozoic strata, involving units as high as the Triassic Chinle Formation." ~ K. J. Wenrich and P. W. Huntoon, "Breccia Pipes and Associated
mineralization in the Grand Canyon Region, Northern Arizona," Geology of the Grand Canyon, Northern Arizona, 28th Int. Geol. Congress, Field Trip Guide Book, (Washington: AGU, 1989), p. 212

"1. An extensive karst developed on the emergent Redwall surface during Late Mississippian time. The Gran Canyon breccia pipes are associated with this Mississippian karst; cavities from this karst served as nucleation points for upward stoping. The modern Yucatan karst provides an excellent analogue for Late Mississippian conditions in the
Grand Canyon." K. J. Wenrich and P. W. Huntoon, "Breccia Pipes and Associated mineralization in the Grand Canyon Region, Northern Arizona," Geology of the Grand Canyon, Northern Arizona, 28th Int. Geol. Congress,
Field Trip Guide Book, (Washington: AGU, 1989), p. 215

Thus, the Redwall caves didn’t collapse until after several hundred feet of sediment was deposited above them. These sediments include the Surprise Canyon formation, the Supai Group, the Hermit shale, the Coconino Sandstone, the Toroweap formation, the Kaibab Limestone and the Triassic up to at least the Triassic Chinle formation. Then the cave collapsed allowing some of the Chinle rocks to fall into the old cave in the Redwall formation. The rocks in the pipes are not soft sediment—they were hard rock when the cave collapsed. The boulders are angular and only hard rocks can sustain angular shapes.


Thus we must have the following sequence of events to explain the data:
1. Cambrian through Mississippian Redwall be deposited.
2. Redwall must be uplifted above sea water.
3. Freshwater rain must dissolve the limestone—lots of time
4. Caves must be lowered again.
5. Surprise Canyon, Supai Group, Hermit Shale, Coconino Sandstone, Toroweap group, Kaibab Limestone and Triassic up to the Chinle must be deposited.
6. Rocks must be hardened
7. The cave collapses allowing Chinle to fall into cave
8. Younger sediments which today lie only north of the Canyon were deposited.
9. Regional erosion removes thousands of cubic km of Triassic and younger rocks from Grand Canyon area

Young-earth creationism has been weighed in the balance and found wanting.


Upvote 0

mark kennedy

Natura non facit saltum
Site Supporter
Mar 16, 2004
22,030
7,265
63
Indianapolis, IN
✟617,130.00
Gender
Male
Faith
Calvinist
Marital Status
Single
Politics
US-Democrat
"The striking regularity with which the same hybrid forms always reappeared whenever fertilization took place between the same species induced further experiments to be undertaken” (Mendel)


Mendel's experiments yielded two laws of science that became the foundation of modern genetics. Without directly observing the chromosomes he built a scientific model that demonstrated how the internal mechanism of inherited traits worked. Nearly half a century later his only surviving paper on the pea plant experiments were discovered and demonstrated again and again in the early 1900s. Mendel noted that one trait masks the other; the one that masks the other is dominant the masked trait is recessive (aka epistasis). It was believed that inheritance was a mixture of characteristics that blended to produce unique internal traits. We know now that the genes, Mendel called the 'elementen', recombine through a process of recombination called Meiosis

Mendel clearly states based on his experiments that the demonstrated mechanisms that are the bedrock of modern genetics had defining boundaries. These boundaries are the elementum (genes) that are separated from each other as gametes form. The gametes join at fertilization and would recombine at random. The traits are expressed in different ways because a gene can exist in alternative forms, or alleles. In summarizing after producing 70 hybrid crosses with each of the seven traits he studied, from 10,000 meticulous experiments, crossing and cataloging some 24,034 plants, over a six year period (1857-1863), Mendel writes:

“Gärtner, by the results of these transformation experiments, was led to oppose the opinion of those naturalists who dispute the stability of plant species and believe in a continuous evolution of vegetation. He perceives in the complete transformation of one species into another an indubitable proof that species are fixed with limits beyond which they cannot change

Darwin proposed natural selection was the mechanism for the change of one species to another, the selection of most favored races, he called it. It was based on the 'geometric growth of populations', which claims that populations tend to populate beyond the ability of the resources to sustain them and there is a struggle to survive. The ones best 'fitted' would survive while the rest would die off, it is simplicity itself, natural selection is the elimination of the less fit. This is how Darwin and neodarwinians see nature, as a red in tooth and claw struggle for survival within a population yielding improved fitness. The only model Darwin offered in Origin of Species was what he called the tree of life starting with an undefined protoorganism and growing like a tree from that single stem into countless branches of living systems. The mechanism he proposed was natural selection:

"But if variations useful to any organic being do occur, assuredly individuals thus characterized will have the best chance of being preserved in the struggle for life; and from the strong principle of inheritance they will tend to produce offspring similarly characterized. This principle of preservation, I have called, for the sake of brevity, Natural Selection. Natural selection, on the principle of qualities being inherited at corresponding ages, can modify the egg, seed, or young, as easily as the adult."

Natural Selection

Mendel’s work and Darwin’s were the basis for the modern synthesis. The concept of modern evolutionary biology itself is a synthesis of Natural Selection and Genetics. What it consists of is modern genetics as the empirical backbone of the a priori presumption of the universal common ancestor evolving into all the branches of living systems by means of natural selection.

Modern evolutionary synthesis

The Modern Synthesis

Everyone seems to know how science works but no one seems to understand how it came to be that way. Just as Mendel and Darwin are foundational to modern evolutionary biology, Newton’s Principia Mathematica is foundational to modern science itself. I consider the experiments at the Royal Society in London to be a watershed moment in science for one reason. Newton was the first scientist to insist that you must demonstrate through tested hypothesis that your theory is valid. The series of experiments demonstrated that the white light was made up of the seven colors of the spectrum and could be refracted and the individual properties modeled using Euclidian geometry. Newton's experiementum crucis (crucial experiment) or Meticulas experimentum (meticulous experiment) was the key demonstration. Once this experiment matched the hypothesis it became a valid (as opposed to proposed) theory. Today if you did the same experiments that Newton did at the Royal Society in London on April 16, 1676 you would get the exact same results. When following the same model as Mendel you will get the exact same results.

What are the real world observations that evolutionary thinkers are basing natural selection on? Darwin used the example of the finches, in different environments different traits are more favorable then others like the size of the beak. The short strong one can break open the pods of certain seeds and the ones that don’t have this beak starve to death and die off. The Mendel ratios then change, I haven’t boiled this down to exact measurements but it would be something like this. The population of finches arrives on the island and the ratio is 3 to 1 in favor of the birds that have the less suited beaks. This is a random variation but over time the ratio changes for 3 to 1 against to 3 to 1 in favor. None of the genes have changed; none of the information written in the language of DNA is edited. In fact the genes that produced a selective advantage for survivors of the drought produced a selective disadvantage in the non-drought years:

“The Grants actually witnessed this in the years following 1982-3 when there happened to be an El Nino flood. After the flood, the balance of seeds changed. The large though seed of plants such as Tribulus became rare in comparison with the smaller, softer seeds of plants like Cacabus. Now smaller finches with smaller beaks came into their own. It wasn’t that large birds couldn’t eat small, soft seeds. But they needed more of them to maintain their larger bodies. So smaller birds now had a slight edge. And, within the population of medium ground finches, the tables were turned. The evolutionary trend of the drought years was reversed. (Dawkins, The Ancestor’s Tale 262)

Cells are populations as well and this become a lot more complicated when you are talking about cells organized in systems like vital organs. Morphology is no longer the only explanation for changes in populations over time; we are now in a world that can look at the differences at a biochemical level. Natural selection is not an explanation and that is why I brought in the quotes from Mendel’s only surviving paper. I have been told repeatedly that I have a burden of proof that there are boundaries beyond which species cannot evolve. The fact is that there are already proven laws of science that prevent this from happening, Mendel’s laws of inheritance.

How genes are duplicated is what genetics is all about and how the genes are recombined is what creates the divergence of character Darwin attributed to natural selection. The S phase is where the DNA is replicated in the cell cycle and there is a checkpoint that insures that the replication is without error. It’s like a quality control inspection in the G2 phase where the cell cycle is stoped. There is another one at the apoptosis checkpoint where if the enzyme survivin has not accumulated, cell death is automatic. Just before the cell completely splits during the anaphase is the spindle assembly checkpoint. Here the spindle must be built, the chromosomes must attached to the spindle and the chromosomes must aligned down the center. If there is a change (transcript error) in the DNA that gets past these, and possibly many others, the result is known as a mutation. They have compared the differences of the human genome to that of the humans, these differences, attributed to mutations, can be reduced to ratios. Bear this in mind as we now begin to look at real world genetic research into comparisons of humans (homo sapiens) and our, supposedly, closest relative the chimpanzee.

Just like fractions are ratios where constants are the denominator and the numerators are the variable, when comparing the differences in DNA sequences the constants are synonymous (Ks) and the nonsynonymous (Ka).

“The size of human brain tripled over a period of _2 million years (MY) that ended 0.2–0.4 MY ago. This evolutionary expansion is believed to be important to the emergence of human language and other high-order cognitive functions, yet its genetic basis remains unknown.”

Evolution of the Human ASPM Gene, a Major Determinant of Brain Size

Despite the fact that the genetic basis for this unprecedented expansion is a mystery to scientists, evolutionists have simply chanted the mantra of the neodarwinians, it happened by natural selection. The size, shape, structure and dating of the fossils been used to paint a picture of an impossible transition with no testable hypothesis by which this transition can be tested on a genetic basis. Here are the particulars on the fossils giving us the timeline.

Early Human Phylogeny

For decades we have been told that the changes needed to evolve humans from apes were just a couple of random mutations, a little selective pressure, a pinch of geologic isolation, and stir for millions of years and you have Homo sapiens. The truth is slowly coming out that it is just not that simple. The structure of the human chromosome 21 and its counterpart chimpanzee chromosome 22 were compared by dozens of world class genetic research scientists, for three years who identified the genetic features that make us uniquely human:

“Human–chimpanzee comparative genome research is essential for narrowing down genetic changes involved in unique human features, such as highly developed cognitive functions, bipedalism or the use of complex language. Here, we report the high-quality DNA sequence of 33.3 megabases of chimpanzee chromosome 22. By comparing the whole sequence with the human counterpart, chromosome 21, we found that:

1) 1.44% of the chromosome consists of single-base substitutions
2) 68,000 insertions or deletions.
3) These differences are sufficient to generate changes in most of the proteins.
4) 83% of the 231 coding sequences, including functionally important genes, show differences at the amino acid sequence level.
5) We demonstrate different expansion of particular subfamilies of retrotransposons between the lineages, suggesting different impacts of retrotranspositions on human and chimpanzee evolution.
6) The genomic changes after speciation and their biological consequences seem more complex than originally hypothesized.”

Coding sequences:

“A total of 140 of these 179 genes show amino acid replacements… In contrast, 47 PTR22q (chimp chromosome 22) genes show significant structural changes affecting at least one of their transcript isoforms. Fifteen genes have indels within their coding region yet retain frame constancy”
When I ask neodarwinians for an explanation on how these changes could occur the most common answer is natural selection. That is not a scientific answer based on directly observed or demonstrated evidence, it is an a priori assumption. Mutations are the only way these differences could be in the these two chromosomes apart from independent creation. Given the effects of mutations as directly observed and demonstrated in modern genetics and Mendle's laws of inheritance it is fundamentally impossible. There is only one logical, scientific and rational explanation for these differences, independant creation.

DNA sequence and comparative analysis of chimpanzee chromosome 22

Finally the Ka/Ks ratio that demonstrates just how far removed we are from our supposedly closest relative, the chimpanzee. Any ratio can be converted into a decimal and when you convert the similarities and differences between old world monkey and new world monkeys to a decimal you get and evolutionary rate of 0.23. When you convert the ratio into a decimal for the evolutionary rate of our MRCA you get .032. For the squirrel monkey (new world monkey) you get .22. (ASPM paper cited above) When you calculate it for the chimpanzee you get .20. And the ratio when converted to a decimal for humans it is 0.61. Now these are not junk DNA, nor are they pseudo genes , Alu elements, or introns. These are the outliers of the nervous system genes. Upon completion of this research project Bruce Lahn had this to say:

One of the study's major surprises is the relatively large number of genes that have contributed to human brain evolution. "For a long time, people have debated about the genetic underpinning of human brain evolution," said Lahn. "Is it a few mutations in a few genes, a lot of mutations in a few genes, or a lot of mutations in a lot of genes? The answer appears to be a lot of mutations in a lot of genes. We've done a rough calculation that the evolution of the human brain probably involves hundreds if not thousands of mutations in perhaps hundreds or thousands of genes -- and even that is a conservative estimate."

Evidence that human brain evolution was a special event
 
Upvote 0

mark kennedy

Natura non facit saltum
Site Supporter
Mar 16, 2004
22,030
7,265
63
Indianapolis, IN
✟617,130.00
Gender
Male
Faith
Calvinist
Marital Status
Single
Politics
US-Democrat
"Among the mutations that affect a typical gene, different kinds produce different impacts. A very few are at least momentarily adaptive on an evolutionary scale. Many are deleterious. Some are neutral, that is, they produce no effect strong enough to permit selection for or against; a mutation that is deleterious or advantageous in a large population may be neutral in a small population, where random drift outweighs selection coefficients"

Rates of Spontaneous Mutaton

Natural Selection proposes that in the struggle for life better fitness is the end result. The descent with modification from a single common ancestor is not a series of testable hypothesis resulting in a repeatable demonstration. Natural selection is a default explanation that targets special creation and assumes materialistic mechanisms as an explanation for the rise of complexity and diversity:

"Although much remains obscure, and will long remain obscure, I can entertain no doubt, after the most deliberate study and dispassionate judgement of which I am capable, that the view which most naturalists entertain, and which I formerly entertained — namely, that each species has been independently created — is erroneous. I am fully convinced that species are not immutable; but that those belonging to what are called the same genera are lineal descendants of some other and generally extinct species, in the same manner as the acknowledged varieties of any one species are the descendants of that species. Furthermore, I am convinced that Natural Selection has been the main but not exclusive means of modification."

On the Origin of Species by Means of Natural Selection, or the Preservation of Favored Races in the Struggle for Life. By Charles Darwin

Little did he know that three years previously Mendel was developing the scientific model that would demonstrate the laws that guide the inheritance of traits he called obscure.

The molecular mechanisms of life are the very things that preclude this morphology because of the meticulous quality control stations in cell replication. The essence of genetics is the structure and function of the gene that follows well established patterns that are resistant to fundamental changes, especially in the DNA code following replication in the S phase of the cell cycle. DNA replication is incredibly accurate, you might get 1 base in 100,000 reproduced incorrectly and as I have already shown there are multiple checkpoints to ensure that any errors in the replication process are repaired at checkpoints in the cell cycle.

If DNA replication were a factory the workers would be the enzymes that run the machinery, handle the raw material, forge the material, inspect the product for discrepancies, repair deficient parts and, if need be, reject defective products and reclaim the raw material. During replication the DNA that has a three dimensional structure that we have become familiar with, the spiral of the double helix. During replication enzymes unwind the double helix into complimentary strand to form the messenger RNA (mRNA), the transportation RNA (mRNA) then moves it out of the nucleolus and sends it to the ribosome where it is transcribed. It is crucial that the mRNA template reading frame on the first codon be kept open, if it is not there will be a stop codon inserted which means it is defective and will not produce a functional protein. The material will end up being broken down and reclaimed (catabolic reaction) and this happens with clockwork precision.

For nearly a century scientist could not analyze and model the molecular components of DNA, all they could really see where the effects and the basic structure. When looking at the basic structure it is very hard to discern differences in human and chimpanzee DNA. How close are the genomes of Homo sapeins and the chimpanzee? Scientists who have been telling us that we are ~98% similar to the chimpanzee, as it turns out was seperates us from the chimpanzee is a lot. Here is a classic example of how the modern synthesis protrays us as virtually identical to chimpanzees:

“Cytochrome C is an enzyme that plays an important role in the metabolism of aerobic cells. It is found in the most diverse organisms, from man to molds. E. Margoliash, W. M. Fitch, and others have compared the amino acid sequences in cytochrome C in different branches of the living world. Most significant similarities as well as differences have been brought to light. The cytochrome C of different orders of mammals and birds differ in 2 to 17 amino acids, classes of vertebrates in 7 to 38, and vertebrates and insects in 23 to 41; and animals differ from yeasts and molds in 56 to 72 amino acids. Fitch and Margoliash prefer to express their findings in what are called "minimal mutational distances." It has been mentioned above that different amino acids are coded by different triplets of nucleotides in DNA of the genes; this code is now known. Most mutations involve substitutions of single nucleotides somewhere in the DNA chain coding for a given protein. Therefore, one can calculate the minimum numbers of single mutations needed to change the cytochrome C of one organism into that of another. Minimal mutational distances between human cytochrome C and the cytochrome C of other living beings are as follows:
• Monkey - 1
• Chicken - 18
• Dog - 13
• Penguin - 18
• Horse - 17
• Turtle - 19
• Donkey - 16
• Rattlesnake - 20
• Pig - 13
• Fish (tuna) - 31
• Rabbit - 12
• Fly - 33
• Kangaroo - 12
• Moth - 36
• Duck - 17
• Mold - 63
• Pigeon - 16
• Yeast - 56

http://www.evowiki.org/index.php/Nothing_in_biology_makes_sense_except_in_the_light_of_evolution]Nothing Makes Sense Except in the Light of Evolution[/URL]


This is where the confusion has come in, structurally the two chromosomes are virtually identical because there is only a 1.2% difference in size. What is more, the G + C content are both around 41% (see Mapping, sequencing and overview of PTR22). That is only a 400kb difference and it is easy to come to the conclusion that they are virtually identical.

Previous estimates of genetic basis for unique human features:
1) Bacterial artificial chromosome (BAC) end sequencing 1.23%.
2) Molecular analysis 2%.
3) Overall sequence difference when taking indels into account ~5%.

DNA sequence and comparative analysis of chimpanzee chromosome 22

When you ask me where there is a scientifically defined boundary beyond which evolutionary change is possible I say Mendel’s laws of inheritance and modern genetics. When I ask for a demonstrated mechanism for descent from a single common ancestor through modification I get the mantra of ‘natural selection’. Up until now it was reasonable, even scientifically viable to believe that the differences were small enough to be accounted for by competition and random variation. Now the evidence is coming in, it’s not that simple.

The indels in PTR22 and HSA21 are nothing more then differences, when they are found in functionally important genes, just like the single base substitutions, nothing is being disrupted. This is not how an indel works when it is the result of a mutation, when an indel is the result of transcript error the workers insert a stop codon, the reading frame is closed and there is a catabolic reaction. Despite this the neodarwinians have their trusty mantra of natural selection that presupposes the mystical process of eliminating the deleterious mutations while preserving the beneficial ones. My question would be simply this, when has there ever been a beneficial effect from an indel? :

“Mutations are considered the driving force of evolution, where less favorable (or deleterious) mutations are removed from the gene pool by natural selection, while more favorable (or beneficial) ones tend to accumulate. Neutral mutations do not affect the organism's chances of survival in its natural environment and can accumulate over time, which might result in what is known as punctuated equilibrium; the modern interpretation of classic evolutionary theory. It should be noted that, contrary to science fiction, the overwhelming majority of mutations have no real effect.”

http://en.wikipedia.org/wiki/Mutation]Mutations[/URL]

For one thing a mutation would have to come in combinations of three in order to form a useful codon. What is more the sequence would have to be in a combination that produced a series of amino acids the provided a useful protein. This gets exponentially more improbable when taken into account that the majority of functionally important genes would have to be fundamentally changed. You can’t just wave a magic wand and make the amino acids fold into useful proteins and triple the size of the brain exponentially along with the density and the frontal lobes. No amount of random combinations of chimpanzee genes could ever produce such a change in form and function. The only way it could happen is thousands of mutations in thousands of genes.

I have already presented the details of the functionally important genes that mark the difference between human chromosome 21 and chimpanzee 22. There may well be an explanation for the overhaul of the genes from the MRCA to the modern Homo sapein, but one thing is clear to me, its not natural selection. I’m not talking about intones, Alu elements or pseudo genes. I am talking about functionally important genes that are known to be responsible for neural functions like these:

“53 genes that included patterning signals of the developing nervous system, downstream components of such signals, transcription factors that specify neuronal phenotypes, and regulators of neural precursor proliferation, apoptosis, differentiation, migration, and morphogenesis. The physiologically biased subgroup had 95 genes, comprised predominantly of neurotransmitters, their synthesis enzymes and receptors, neurohormones, voltage-gated ion channels, synaptic vesicle components, factors involved in synaptic vesicle release, metabolic enzymes specific to neurons or glia, and structural outliner components of the nervous system.”

The explanation of Bruce Lahn was hundreds, if not thousands of mutations in hundreds if not thousands of genes. But what happens when key genes involved in neural functions have mutations?:

“…mutations in human ASPM, MCPH1, PAFAH1B1, and SHH all result in severe reductions in brain size (microcephaly).”

That’s not an explanation. How about adaptive selection and relaxed functional restraint?

“One possible interpretation is adaptive evolution of these genes in primates, but it could also be due to relaxed functional constraint. We note, however, that brain size and complexity are much greater in primates than in rodents, which likely places stiffer demands on the functional precision of genes. It is therefore difficult envision the relaxation of functional constraint as a major force in the evolution of the primate nervous system…

…mutations in many nervous system genes, including those with significantly higher Ka/Ks in primates, have been shown to cause severe nervous system defects in humans (Table 1A). This obviously does not support the notion of functional relaxation in these genes during human evolution.”

Accelerated Evolution of Nervous System Genes in the Origin of Homo sapiens

Natural selection did not come from science and natural science does not need it. It came from a poem written by Erasmus Darwin in a book that, appropriately, had an etching of the goddess Artemise on the cover page:

Organic life beneath the shoreless waves
Was born and nurs'd in ocean's pearly caves;
First forms minute, unseen by spheric glass,
Move on the mud, or pierce the watery mass;
These, as successive generations bloom,
New powers acquire and larger limbs assume;
Whence countless groups of vegetation spring,
And breathing realms of fin and feet and wing.

The Temple of Nature
 
  • Like
Reactions: Smidlee
Upvote 0