Global Warming & Earth’s Global Temperature Measurement

Subduction Zone

Regular Member
Dec 17, 2012
32,628
12,068
✟230,461.00
Faith
Atheist
Marital Status
Single
Fascinating little vid, thankyou! :thumbsup:

Not really. For all of his whining about the Arctic not being global the video that he linked made a big thing about the Medieval Warm Period. This does not show up on global maps since it was largely a European phenomenon. It also looked like it was grossly exaggerated since the warm period was little wamre than it is now and it swamped the hockey stick in the video.

Cherry picking and misrepresenting data is not honest.
 
Upvote 0

andypro7

Junior Member
Nov 26, 2014
309
12
Visit site
✟7,969.00
Faith
Non-Denom
Marital Status
Single
I not only posted a link that had the data, I copied and pasted a graph that shows there was warming over that period

No, you did not. You posted a graph of temp anomalies from 1950 -2012. Yes, it includes 16 of the last 18 years, and it shows the anomalies from those years, but it does not show warming for the last 18 years.

In order to do that, you'd have to use SCIENCE and show the previous 18 year trend line. You know, like the graph I linked to, which shows the EXACT period which we're discussing, and shows the trend line for that period.
 
Upvote 0

andypro7

Junior Member
Nov 26, 2014
309
12
Visit site
✟7,969.00
Faith
Non-Denom
Marital Status
Single
Yes, I found your article and the data was bogus, or did you forget that. I tried to chase down the links to his supposed sources and the first two did not work. I gave up after that.

The data for the global temperatures was RSS + UAH sat data, one of the 4 major global temp sets.

The first graphs comparing the IPCC predictions to actual data comes from the IPCC's own First Assessment Report in 1990. It says so in the story and on the graph.

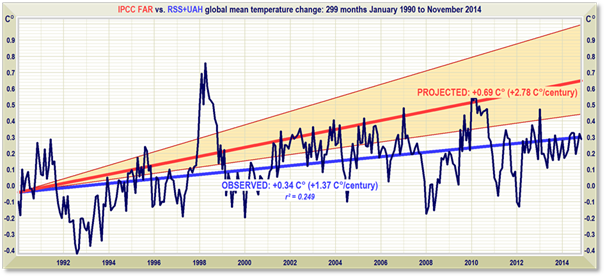
The second graph comparing the IPCCC predictions to actual data comes from the IPCC's own Fifth Assessment Report


Now, you have officially said that 'the data was bogus'

So, now that you have seen this, you have said that 'the data was bogus'

In order to have any credibility, please share which data is not correct, and then back it up with reasons and correct the data. This is how science works.

Once again, this shows why you can't talk to the warmists, every conversation goes just like this one, something like this:

1. Warmist - "The globe is warming, and it's getting worse all the time"
2. Science - "Uh, not it's not, here's the proof"
3. Warmist - "That's not proof, it's a lie, it has to be, because I don't believe it"
4. Science - "Ok, show me where the data is incorrect, so that we may correct it"
5 Warmist - "It has to be incorrect, because I said so"

#5 hasn't happened yet, but I'm sure it will.

Here's where we're at

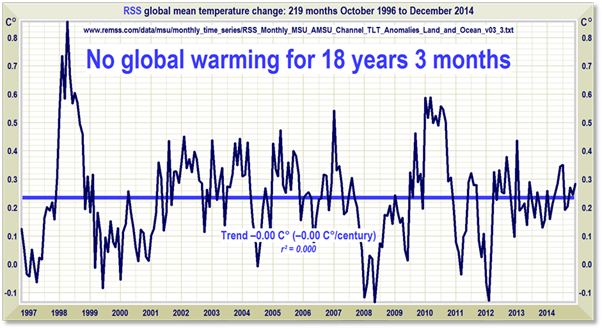
1. I say there has been no statistical global warming for 18yrs 3 months
2. I present widely accepted RSS/UAH data, with trend line
3. You refuse to accept data, but cannot refute it

That's it, the truth is RIGHT THERE. By refusing to accept it, you're basically saying that you're not interested in facts, just your own opinion. And, you know what, this is America, and I should be fine if that's what you want to do. You just shouldn't be posting in a forum about science questions.
 
Upvote 0

andypro7

Junior Member
Nov 26, 2014
309
12
Visit site
✟7,969.00
Faith
Non-Denom
Marital Status
Single
And wrong again. You admitted that you ignored the evidence that I linked, the graph that I posted from NASA, a reliable source if there ever was one, and it showed that you are wrong.

I did not IGNORE the evidence you linked As I explained, the discussion is about the lack of global warming for the last 18 years. You showed a graph for the last 63 years, and with no trend line. You do not understand apparently how to show the trend line for the last 18 years.

You are relying on a fruitbar that was shown to change sources when they disagreed with him.

Ok, let's say that I agree with your little story about Anthony Watts (I don't of course, but I'll admit it could be correct, since I haven't looked at it. You see, that's how honest science works, you don't claim something is incorrect until you've examined it)

But the reason I've not examined it is it's another warmist trick when they are proven wrong to change the subject. I'm not changing the subject.

AND, if we use your standard, then we can accept NOTHING from the IPCC, who have also, by YOUR standard, have been proven, BY THEIR OWN WORDS, to have fudged the data, hid the decline, and trying to subvert the peer review process. So, if we use your standard, you have NO EVIDENCE whatsoever to show.

And (this is the best part), not one single word in that article was written by Anthony Watts. Ha Ha.
 
Upvote 0

andypro7

Junior Member
Nov 26, 2014
309
12
Visit site
✟7,969.00
Faith
Non-Denom
Marital Status
Single
If you actually had data from the one of "the four major data sets" you would have linked or least attempted to link it directly. Instead you linked a denier's website that claimed he had that data. That makes you a denier. Always go to the source. Never rely on someone else to go to the source for you

Once again, the data is graphed. If there is an error in the data, it's up to you to show it scientifically, not use a logical fallacy and then say it's wrong. And once again with the circular reasoning, here's what you've set up to make sure you never learn:

1. If you don't believe in global warming, you are a denier
2. You must show me proof that there's no global warming
3. If someone shows proof that there's no global warming, then they are a denier
4. Since they are a denier, their proof isn't valid
 
Upvote 0

andypro7

Junior Member
Nov 26, 2014
309
12
Visit site
✟7,969.00
Faith
Non-Denom
Marital Status
Single
And once again, watch the false charges. I will not report you for this, but it what you have done is against the rules here. Politeness is a must

Politeness is a must, says the guy that continually compares those who disagree with him to Holocaust deniers. That's rich.

I'm sorry I called your global warming belief a religion. But since you've refuse to accept scientific evidence, it's certainly not science. But I'll change, from now on I'll just call it global warming fan fiction.
 
Upvote 0

andypro7

Junior Member
Nov 26, 2014
309
12
Visit site
✟7,969.00
Faith
Non-Denom
Marital Status
Single
Here we see official RSS/UAH data from Oct 1996 to Dec 2014, with trend lines drawn to show no statistical global warming for that period.


clip_image002.png
 
Last edited:
Upvote 0

andypro7

Junior Member
Nov 26, 2014
309
12
Visit site
✟7,969.00
Faith
Non-Denom
Marital Status
Single
Next we see the IPCCs own dire predictions from their first assessment report in 1990. The blue line represents the actual observed data.
The other lines at the top represent the IPCCs three scenarios, and you can see that the observed temperatures turned out to be lower than even their lowest estimates.

Why again do we put any trust in what they say when they can be proven wrong?


clip_image004.png
 
Upvote 0

andypro7

Junior Member
Nov 26, 2014
309
12
Visit site
✟7,969.00
Faith
Non-Denom
Marital Status
Single

Once again, not relevant, but typical.

I assert, then prove, that there has been no global warming since Oct 1996, then you post a slideshow that shows that there has been global warming for some other period of time.
 
Upvote 0
This site stays free and accessible to all because of donations from people like you.
Consider making a one-time or monthly donation. We appreciate your support!
- Dan Doughty and Team Christian Forums

andypro7

Junior Member
Nov 26, 2014
309
12
Visit site
✟7,969.00
Faith
Non-Denom
Marital Status
Single
Completely relevant. You are cherry picking the data, and that is what the other graph shows.

The point of the graph is to show that the warming has stopped, that it is not currently occurring, and that it's not getting exponentially worse, as we've been told for decades.

The assertion from the warmist camps for the last 20+ years is that as CO2 continues to rise, the temps would continue to rise and it would get exponentially worse. Since CO2 has continued to rise, The 18 year graph refutes that assertion.

You say I'm cherry picking data, and I would be if I were trying to assert what you claim I'm trying to assert, but I'm not. Here is what I'm saying:

1. The 'experts' have told us that it will continue to get warm, and exponentially so, and that increases in CO2 will lead to increases in temperatures
2. I'm saying that the last 18 years, with increases in CO2, proves that the 'experts' were wrong, since there has been no warming for 18 years.
3. Since they didn't predict anything close to what actually occurred, it just makes good sense to doubt their future predictions as well, doesn't it.
 
Upvote 0

Loudmouth

Contributor
Aug 26, 2003
51,417
6,141
Visit site
✟98,005.00
Faith
Agnostic
The point of the graph is to show that the warming has stopped,

Just like it stopped multiple times in this graph.

escalator_2012_500.gif


You are cherry picking the data.

The assertion from the warmist camps for the last 20+ years is that as CO2 continues to rise, the temps would continue to rise and it would get exponentially worse. Since CO2 has continued to rise, The 18 year graph refutes that assertion.

That is a strawman. Climatologists have always said that climate is complex and that there would never be a 1:1 correlation. It doesn't change the fact that CO2 is the major driver of warming seen in the data.
 
Upvote 0
This site stays free and accessible to all because of donations from people like you.
Consider making a one-time or monthly donation. We appreciate your support!
- Dan Doughty and Team Christian Forums

Loudmouth

Contributor
Aug 26, 2003
51,417
6,141
Visit site
✟98,005.00
Faith
Agnostic
Except that CO2 has risen steadily in the last 18 years but temps have remained flat

Pesky things, those facts.

CO2 has steadily risen over the last 100 years, and so has temperature. Pesky things, those facts.

When you are ready to deal with all of the data instead of cherry picked data sets, let us know.
 
Upvote 0

Subduction Zone

Regular Member
Dec 17, 2012
32,628
12,068
✟230,461.00
Faith
Atheist
Marital Status
Single
Except that CO2 has risen steadily in the last 18 years but temps have remained flat

Pesky things, those facts.

By perhaps only one method of measurement only. And as pointed out, the founder of your website switched from one method of measurement to another when his first source did not agree with him.

I still have not found the original graph that Monckton supposedly based his upon.
 
Upvote 0

Subduction Zone

Regular Member
Dec 17, 2012
32,628
12,068
✟230,461.00
Faith
Atheist
Marital Status
Single
I not only posted a link that had the data, I copied and pasted a graph that shows there was warming over that period

No, you did not. You posted a graph of temp anomalies from 1950 -2012. Yes, it includes 16 of the last 18 years, and it shows the anomalies from those years, but it does not show warming for the last 18 years.

In order to do that, you'd have to use SCIENCE and show the previous 18 year trend line. You know, like the graph I linked to, which shows the EXACT period which we're discussing, and shows the trend line for that period.


Anomalies show the warming for the last years, what do you think an "anomaly" is?


And no, your graph does not show that. It was cherry picked data at best. We have gone over that. Even you admitted it was cherry picked when you said the other methods show warming.
 
Upvote 0

Subduction Zone

Regular Member
Dec 17, 2012
32,628
12,068
✟230,461.00
Faith
Atheist
Marital Status
Single
And once again, watch the false charges. I will not report you for this, but it what you have done is against the rules here. Politeness is a must

Politeness is a must, says the guy that continually compares those who disagree with him to Holocaust deniers. That's rich.

I'm sorry I called your global warming belief a religion. But since you've refuse to accept scientific evidence, it's certainly not science. But I'll change, from now on I'll just call it global warming fan fiction.

When did I even mention Holocaust deniers? And I accept scientific evidence, you are the one that is making the error of cherry picking one questionable source.

Again, let's see the original graph that Monckton based his upon. Or did he simply make his own? In that case why wasn't he clear on his methodology?
 
Upvote 0
This site stays free and accessible to all because of donations from people like you.
Consider making a one-time or monthly donation. We appreciate your support!
- Dan Doughty and Team Christian Forums

andypro7

Junior Member
Nov 26, 2014
309
12
Visit site
✟7,969.00
Faith
Non-Denom
Marital Status
Single
When did I even mention Holocaust deniers? And I accept scientific evidence, you are the one that is making the error of cherry picking one questionable source.

Again, let's see the original graph that Monckton based his upon. Or did he simply make his own? In that case why wasn't he clear on his methodology?

It wouldn't be a graph, it would be a data set. A data set that is plotted, and then graphed, and then a trend line is produced. Just like EVERY OTHER GRAPH, including every single one you've posted. This is just juvenile.

The data is available from RSS/UAH. Feel free to get the data and graph it for yourself. But unless you have any evidence that the data was hockey sticked, shut up about it. You don't believe the data because you don't want to. No matter what, you'll never believe it.

That is not scientific.
 
Upvote 0