You were using the counts I provided as far as I could tell.
When I did the chi squared tests. When I did the histograms I needed to download all the data. (That's why the histograms were as large as they were.) MY first post in this thread used downloaded data, complete sets. So I've been downloading the full sets from the start here.
But you are correct it takes lots of work to look at the raw data. They don't make it easy.
Agreed.
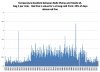
That is the average. You ignore the 25% of the days where the temperature difference is greater than 3 degrees. Indeed, the average of the absolute value of the temperature difference is 2.7 deg. That is over a record since 1948. By taking out the sign of the difference one can see the magnitude of the average temperature difference. It seems that on average there is a temperature gradient equal to a moderate cold front.
If I weigh myself on two bathroom scales every day. One is offset from the other by 1 lb I can still track the increase or decrease of my weight.
And as far as I can tell failed to actually mention.
Actually in the chi square discussion I was pretty explicit about that. In fact that was the only thing I
could test for with that data. (
http://www.christianforums.com/t7394133-17/#post52740154)
But your methodology was flawed.
Then please show me how the chi square calculation was in error. For 20 deg, 10 deg and 5 deg the chi square test resulted in insignificant p values which means one cannot reject the null hypothesis.
All you need do is show me in the calculation where I miscalculated.
All one has to do to see a big bias is to look at the plots of the annual average temperature--which I posted.
No, the "big bias" was a 1 deg median difference. Sure there's larger differences on different days but the median of the data, the median of the difference over 60 years was 1 degree.
Your graph showed a difference but my histogram clarified how large that difference came out to in the overall data set.
I am moving on to other data sets. I think we have discussed this one enough.
Excellent idea.
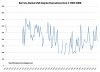
Tonight I am going to post a picture for two UK towns, Ringway and Shawbury.
I will have to have the raw data. After all that is why I found this discussion interesting. No filters. Just raw data.
One can see that when I subtract the two temperature trends for these two towns merely 51 miles apart, since 1988 Ringway has experienced more 'global warming' than Shawbury. The warming in Ringway doesn't seem to extend to Shawbury but CO2 should have the same effect in both towns unless people think that CO2 likes the pubs in Ringway better than those in Shawbury.
I don't have the raw data, but I will grant there is a trend in the differences there. Of course the average difference looks at first glance as if it will still work out to be only a couple of degrees.
At least in this case the trend does show that it would be difficult to consider these two as reasonably good replicates.
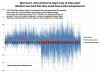
The Chinese data is near Guangzhou, a city I have been to many many times. It is a beautiful city in subtropical China.
I liked Guangzhou as well. I only got to stay a couple days. Had a great adventure on an afternoon trip to Hong Kong by rail when I found out that China, even though it now controls Hong Kong likes to require a separate entry visa to get back in. I got a nice night in a nice hotel in Hong Kong.
Such lunatic variances in temperature make it insane to think that we can use the meteorological temperature data to determine a trend.
But again, the key that keeps getting ignored is that the temperature data is averaged over large areas so any consistent temperature differences (as in the prior discussion, where the difference median was 1 deg F) aren't as problematic. The trends in global warming are not based on single stations. Nor should they be. Of course there's going to be errors. But if we must address each station individually then it is important that we use a statistically robust analysis.
By the way Contracelsus, you still haven't addressed the physics issue.
That's OK, you haven't directly addressed any of the errors you seem to see in my statistics. A calculation would be helpful. You also haven't addressed my question about what would be your preferred type of data set. One without any errors whatsoever? Would you trust it if there was absolutely no error?
Talking about data distribution won't cut it.
I thought you were the guy who said:
Finally someone who actually likes to analyze data
If your going to pick apart the data on a station-by-station basis I think it quite reasonable to discuss the data at this level. That is precisely why statistics is powerful.
Do you think it is reasonable for a strong cold front temperature gradient to exist between these two towns for 25% of the days
I thought I had addressed this. Mea culpa if I hadn't. First of all I am unsure how to differentiate between a legitimate cold front between two town and actual plain ol'
error in the measurement. Who knows? Maybe one day Clyde the temperature reader in 1953 was too cold to get the temp right so he wrote down a number that was 5 degrees off of what it was really?
I think this is the importance of looking at the statistics. Errors are found everywhere. If there's a system that produces error-free data then I am afraid it would raise more eyebrows and probably be less trusted than normal things here in the physical world.
over the past 62 years?? Please answer the question. YOu didn't answer the physics issue.
Well now I have. You are drawing conclusions around the error in the data and asking if I believe it to be perfectly real. Clearly I do
not believe it is likely that on Aug 13, 19XX there was a 40 degree difference between the stations. However I am fully aware of error in any measurement system.
Now I have addressed your physics question. If you could please return the favor and address the reasons why the statistics I have calculated are in error. I have provided numerous citations as to which statistical tests I am using, I can also provide you with author/title and publisher of the stats books I have here at home if you like. We can work through the problems together.
And please do be aware that part of the fun for me is to analyze the data, not just look at the pictures. If I can learn more statistics then I consider this to be a very fruitful conversation.