- May 15, 2005
- 11,935
- 1,498
- Country
- United States
- Gender
- Male
- Faith
- Christian
- Marital Status
- Married
- Politics
- CA-Conservatives
Dude, I'm quite happy to admit that you know far more about science and engineering than I do. I'm also quite happy to point out that you are still avoiding the FACT that this term is used to discuss energy in the atmosphere! If you even looked up the basic WIKIPEDIA on WATT, you'd see this reference:
Forgot to mention that did we? Oops!")
You can talk down to me all you want, but it doesn't make the fact that the peer-reviewed climate scientists choose to use the term watt when discussing atmospheric energy. Are you also a qualified climatologist? I thought not.
There is no such thing as "my industry's use of the term." The word has a meaning, and that meaning is universal across all sciences. A watt is a unit of energy flow, not a unit of energy. That is why it is impossible to "trap" a watt of "energy." A watt cannot be trapped. A joule can be trapped, but not a watt.
I would like to see one of your peer-reviewed articles that says such a thing, for that would be a nail in the coffin for their fraud. Anyone who speaks of "trapping" a "watt" of energy does not understand enough to calculate how long it would take a cup of coffee to cool, much less how hot the earth will be a hundred years from now. Whether he calls himself a scientist or not, such a person is a total ignoramus when it comes to heat.
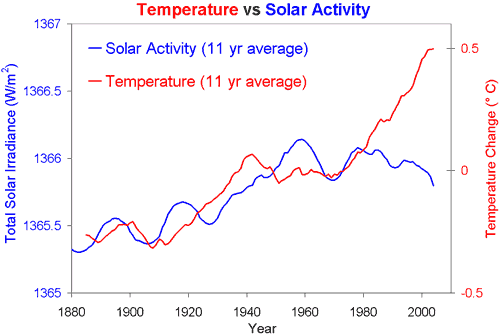
Your argument about this is only digging yourself deeper into the hole you have already dug. The only thing you are proving is that you do not even understand the data you are quoting. And by the way, the wikipedia article uses the term correctly. I have used the solar irradiance, which is measured in watts per square meter, in calculations many times. For I design solar heating systems.
Last edited:
Upvote
0


 They even fund church groups like the

