"going down"????
Really????
(Remember: there's a difference when talking about graphs between "going up", "going down" and "remaining flat". I'd go into detail on what a statistically significant slope means, but it's been so hashed out on these boards that every single skeptoid on here should know the importance of it).
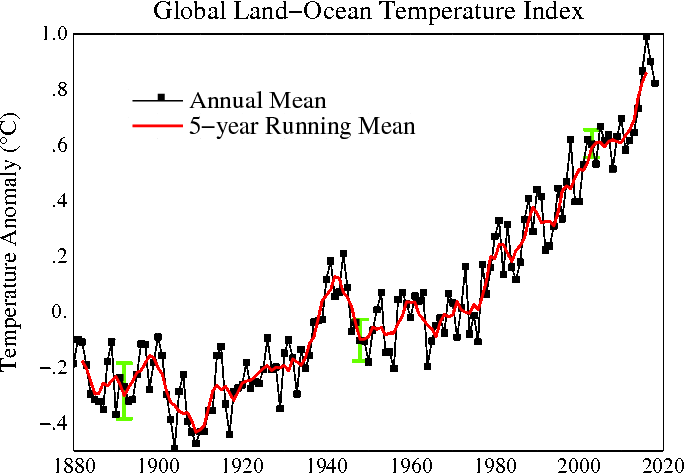
When you have a time-series you have to see as much of the data as is possible. It is illegitimate to "window down" an area and say "Ah ha! this confirms my biased suspicions!"
As Rick pointed out, there are blocks of time in which the trend has flattened or dropped but
the overall trend is upwards.
Because it's so good, I'll repost the graph that RickG posted earlier...it shows this effect quite clearly:
Do you notice anything there, Greatcloud? Anything at all? Look closely. Watch the animation. You see anything that kind of looks familiar to your argument?
All I am saying is that now as of now the temps are going down and have been going down gradually for 15 years. That is the situation we have now.