Yeah those files are hard to work with. I use the raw observation. The reason I don't like the tobs is that it is a midnight correction.
"Next, the temperature data are adjusted for the time-of-observation bias (
Karl, et al. 1986) which occurs when observing times are changed from midnight to some time earlier in the day. The TOB is the first of several adjustments. The ending time of the 24 hour climatological day varies from station to station and/or over a period of years at a given station. The TOB introduces a non climatic bias into the monthly means. The TOB software is an empirical model used to estimate the time of observation biases associated with different observation schedules and the routine computes the TOB with respect to daily readings taken at midnight."
GHCN Global Gridded Data
Why do I not believe it? Because as the picture below shows, once again there is little Tobs correction to the values in 1900.
http://cdiac.ornl.gov/epubs/ndp/ushcn/ts.ushcn_anom25_diffs_pg.gif
Wow, does this mean that the people in 1900 got up at midnight to read the stations, or read them at 10 pm so the Tobs correction is small? I doubt that very seriously. But, the Tobs correction is selectively applied in a positive fashion only to stations after 1970--and guess what? That is about the time that the temperature rise took off.
But just going off the raw data here I, too, plotted the 2000-2008 differences. But I went one step further and plotted daily differences in the MIN and MAX temperatures as well as AVERAGE:
You should be happy, Glenn, these are reasonably or pretty close to normally distributed! We can work with the means rather than just the medians.
Now, yes, there is a mean difference in T[sub]ave[/sub] of
-1.5degF for these 8 years. But it is reasonably normally distributed around that, which means that sometimes there's a positive bias!
Same thing for the MINs and MAXs.
So, does it mean that
maybe one station is sited "cooler" than the other or the other one is "hotter"? Well, there's definitely something. But
-1.5[sup]o[/sup]F? Really?
Do you think this error will propogate significantly in a
gridded average?
I would be very interested in seeing the station history for these two stations. But I'll have to wait to download them.
We still might quibble a bit about how gaussian the distribution is, but lets set that aside. Once again you ignore PHYSICS! We shouldn't see this kind of seasonal bias if we are measuring the temperature of both towns correctly.
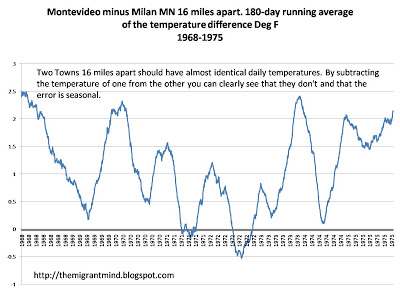
Now, the overall bias also is variable.For 2000-2008 Montevideo is hotter than Milan, but for 1968-75 it is the opposite. It is exactly the reverse of the 2000-2008 trend. The stations reverse, but not by the same amount.
(By the way: so now we assume that there must be less than 1.5degF difference between station readings in your assessment in order for the data to be "acceptable"?)
No, the actual spread is from +1.5 to around - 1.5 deg F--over the history of the towns we have had quite a variation in the temperature differences. And remember it isn't the distribution of the temperature difference that is important. The temperatures should be the same, or so dang close to it that it is not often different. Yet we find 2.5 deg variation throughout a year, if we look over a long enough period.
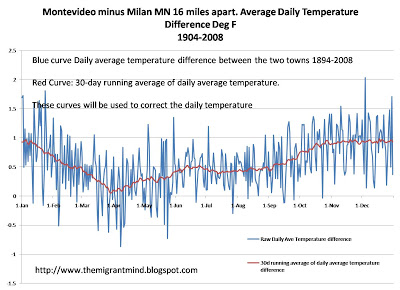
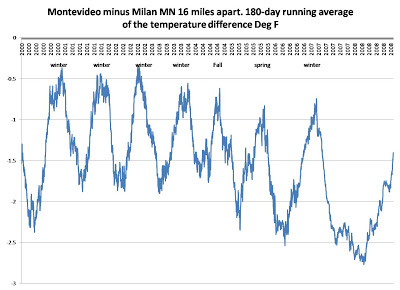
Tomorrow night I will post the average of the daily temperature difference for each day between these two towns. The seasonality is there and that means that we are measuring something other than the earth's temperature. We are measuring whatever that heat source is.
Yet that doesn't bother you. You only think that distribution is important. It isn't. We shouldn't HAVE a variation of this size if we are actually measuring what we say we are measuring.
By the way Thau, you have consistently avoided my questions.
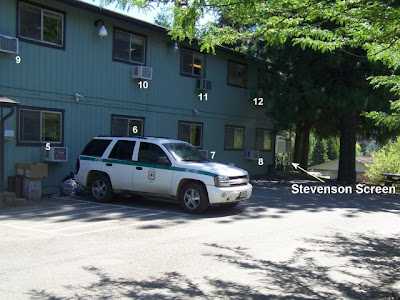
Would you take your child's temperature and put the thermometer next to a match or the stove before you read it for the doctor?
Would you, if you wanted to know the temperature inside your house, put the thermometer next to the stove?
If so, why? If not so, why? Answer the darn questions.
") Otherwise I too would have been at the dictionary.
Otherwise I too would have been at the dictionary.