- Sep 5, 2012
- 5,807
- 2,210
- Faith
- Atheist
- Marital Status
- Single
- Politics
- US-Others
Ok, so this is the first of a three part series, tackling the "big 3 assumptions" that are often cited as "evidence" against radiometric dating. Those 3 assumptions are:
1. Scientists assume the initial quantities of parent and daughter isotopes
2. Scientists assume the rock being tested has remained a closed system
3. Scientists assume that radioisotopes have decayed at a constant rate
This is kind of a rough draft, and I will be editing it, as people point out mistakes. But I think you'll get the idea.
This first thread will be dealing with number 1.
It is important to note, that the creationists who have spent the most time and money researching radiometric dating techniques...the so called "R.A.T.E." team...does not argue in favor of assumptions 1 and 2, because they are, indeed, not assumptions that scientists make; a point which R.A.T.E. agrees with--they are not assumptions. They have focused their attention on number 3, which we will get to in part 3 of this series.
When radiometric dating was first being developed, Assumption #1 did play a roll. Scientists observed that zircons rejected lead up until their closure temperature, so it was assumed that any lead in the zircon was from radioactive decay. Likewise, scientists observed that argon gas would diffuse from lava until it reached closure temperature, so it was assumed that any argon in the rock would be from radioactive decay.
This is the origin of the claim that creationists make.
However, since then, we have developed techniques which compensate for these assumptions, and indeed, help us to actually determine the very small amounts of initial daughter product in the sample.
The K/Ar assumption was compensated for by a method called step heating, which instead looked at the ratio between Ar40 and Ar39, instead of K40 and Ar39. The data from this method is plotted on a graph called an age spectrum.
The U/Pb assumption is compensated for by a couple of different methods which I am currently studying.
The one we will be looking at, however, is the compensation for the assumption in the Rb/Sr method. This method accounts for the initial quantity of Sr using a method called the isochron method. The isochron method can also be used for the other two systems I mentioned, but is not the preferred graph for those methods.
Rubidium-87 decays to Strontium-87 through beta decay at a 1 to 1 ratio. i.e., one atom of Rb87 decays to form one atom of Sr87 (plus an emitted beta particle, which is what radiation is).
Strontium-86 is a stable isotope of Sr, so it is used to compare the change in levels of Rb87 and Sr87 as decay occurs, by comparing the ratios of each.
For example: Say the current ratio of Rb87:Sr86 is 10:1, and the current ratio of Sr87:Sr86 is 3:1. After a certain amount of time, some Rb87 will decay. Since Sr86 is stable, it's concentration in the sample will not change. So, the new ratio of Rb87:Sr86 will decrease to, say, 9:1.
Since Rb87 decays into Sr87 at a one to one ratio, the new ratio of Sr87:Sr86 would be higher, so 4:1.
So as the ratio of Rb87:Sr86 decreases through decay, the ratio of Sr87:Sr86 increases at the same rate.
The next thing to know is what scientists mean by "resetting the radiometric clock."
When rock is melted into lava, all the elements that were trapped in minerals get mixed together. This is called homogenization. When the lava cools, and new minerals form, some of them, because of their chemical properties, will incorporate Rubidium better than Strontium, and some will incorporate Strontium better than Rubidium. So when you take samples of these new minerals, you will have different ratios of Rubidium-87:Strontium-86.
However, since Strontium-87 is so chemically similar to Strontium-86, all the newly formed minerals will have the same ratio of Sr87:Sr86, since the minerals do not prefer one over the other, like they do with Rb87:Sr86. This is important, as you will see shortly.
The previous two paragraphs can be, and have been, observed by measuring current ratios in newly formed rock.
Here is a graph that plots a hypothetical sampling shortly after lava rock cools. Say, from the current lava flow in Hawaii. The numbers are not pulled from any actual data, I’m simply labeling arbitrary ratios for ease of demonstration.
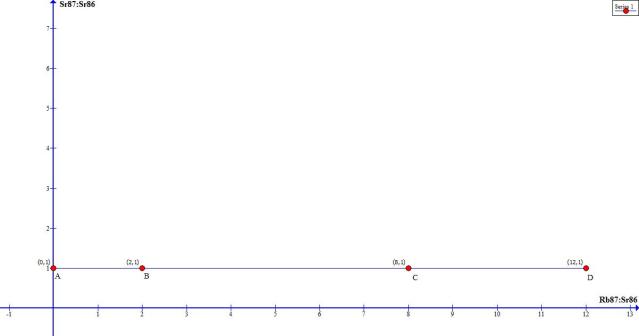
I would like you to notice a couple things:
1. the ratio of Rb87:Sr86 is on the x-axis, and the ratio of Sr87:Sr86 is on the y-axis.
2. Sample A is a hypothetical mineral which completely rejects Rubidium.
3. Because the Sr87:Sr86 ratio is the same in all the minerals (A through D), due to homogenization while in the lava state, the graph forms a flat line, with the x value representing the amount of Rubidium across the 4 minerals.
Ok, now suppose one Rubidium half –life from now (yes, I know the Rb half-life is billions of years; bear with me, I’m just trying to make the graph easy to produce and read) we re-measure minerals from the same rock sample. We get a new graph which looks like this:
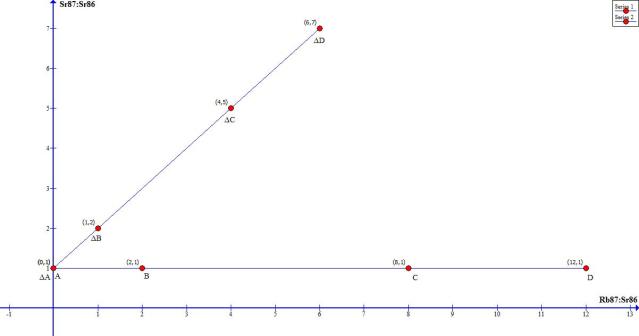
This is what I want you to notice on this graph:
1. So now, hypothetically, we have both graphs. The initial quantities and the quantities one half life later
2. For every sample, the decrease (decay) in Rb87 is equal to the same increase in Sr87
3. The new graph still plots on a line, but now it has slope
4. Sample A and (delta)A are at the same point. Why? Since that sample had no Rb87 in it, there is nothing to decay into Sr87. One half-life later, there is still no Rb87, and since Sr87 has therefore not increased, the ratio Sr87:Sr86 remains the same.
Ok, so what does this mean? Well, let’s look at this next graph, which represents what the future scientists will see, if they had lost the data from our current measurements of the Hawaii flow. In other words, this is what the graph looks like to US when we date old rocks:
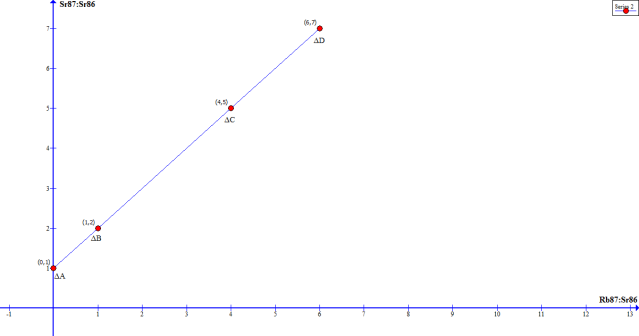
Can you see how we determine what the initial concentration of Sr87 was? Since sample (delta)A had no Rubidium in it to begin with, the Sr87 concentration never changed. In other words it is the same as the initial concentration.
Therefore, the y-intercept represents the initial concentration of Sr87.
Now lets look at a graph with real, measured data:
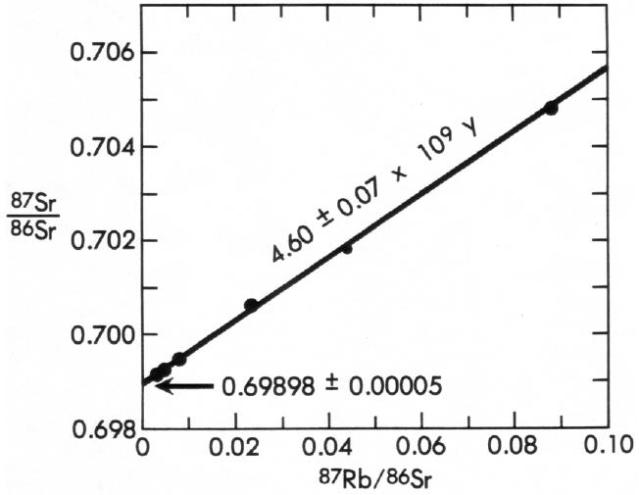
Figure 3: Rb-Sr isochron for the meteorite Juvinas. The points represent analyses on glass, tridymite and quartz, pyroxene, total rock, and plagioclase. After Faure (49). Data from Allegre and others (3).
From:How Old is the Earth: Radiometric Dating
Since we now know that the y-intercept represents the initial Sr87 concentration, we know that the initial ratio in this example was .69898 +/- .00005.
And THAT is why we NO LONGER assume the initial quantities. We don't even need them to be zero.
1. Scientists assume the initial quantities of parent and daughter isotopes
2. Scientists assume the rock being tested has remained a closed system
3. Scientists assume that radioisotopes have decayed at a constant rate
This is kind of a rough draft, and I will be editing it, as people point out mistakes. But I think you'll get the idea.
This first thread will be dealing with number 1.
It is important to note, that the creationists who have spent the most time and money researching radiometric dating techniques...the so called "R.A.T.E." team...does not argue in favor of assumptions 1 and 2, because they are, indeed, not assumptions that scientists make; a point which R.A.T.E. agrees with--they are not assumptions. They have focused their attention on number 3, which we will get to in part 3 of this series.
When radiometric dating was first being developed, Assumption #1 did play a roll. Scientists observed that zircons rejected lead up until their closure temperature, so it was assumed that any lead in the zircon was from radioactive decay. Likewise, scientists observed that argon gas would diffuse from lava until it reached closure temperature, so it was assumed that any argon in the rock would be from radioactive decay.
This is the origin of the claim that creationists make.
However, since then, we have developed techniques which compensate for these assumptions, and indeed, help us to actually determine the very small amounts of initial daughter product in the sample.
The K/Ar assumption was compensated for by a method called step heating, which instead looked at the ratio between Ar40 and Ar39, instead of K40 and Ar39. The data from this method is plotted on a graph called an age spectrum.
The U/Pb assumption is compensated for by a couple of different methods which I am currently studying.
The one we will be looking at, however, is the compensation for the assumption in the Rb/Sr method. This method accounts for the initial quantity of Sr using a method called the isochron method. The isochron method can also be used for the other two systems I mentioned, but is not the preferred graph for those methods.
Rubidium-87 decays to Strontium-87 through beta decay at a 1 to 1 ratio. i.e., one atom of Rb87 decays to form one atom of Sr87 (plus an emitted beta particle, which is what radiation is).
Strontium-86 is a stable isotope of Sr, so it is used to compare the change in levels of Rb87 and Sr87 as decay occurs, by comparing the ratios of each.
For example: Say the current ratio of Rb87:Sr86 is 10:1, and the current ratio of Sr87:Sr86 is 3:1. After a certain amount of time, some Rb87 will decay. Since Sr86 is stable, it's concentration in the sample will not change. So, the new ratio of Rb87:Sr86 will decrease to, say, 9:1.
Since Rb87 decays into Sr87 at a one to one ratio, the new ratio of Sr87:Sr86 would be higher, so 4:1.
So as the ratio of Rb87:Sr86 decreases through decay, the ratio of Sr87:Sr86 increases at the same rate.
The next thing to know is what scientists mean by "resetting the radiometric clock."
When rock is melted into lava, all the elements that were trapped in minerals get mixed together. This is called homogenization. When the lava cools, and new minerals form, some of them, because of their chemical properties, will incorporate Rubidium better than Strontium, and some will incorporate Strontium better than Rubidium. So when you take samples of these new minerals, you will have different ratios of Rubidium-87:Strontium-86.
However, since Strontium-87 is so chemically similar to Strontium-86, all the newly formed minerals will have the same ratio of Sr87:Sr86, since the minerals do not prefer one over the other, like they do with Rb87:Sr86. This is important, as you will see shortly.
The previous two paragraphs can be, and have been, observed by measuring current ratios in newly formed rock.
Here is a graph that plots a hypothetical sampling shortly after lava rock cools. Say, from the current lava flow in Hawaii. The numbers are not pulled from any actual data, I’m simply labeling arbitrary ratios for ease of demonstration.
I would like you to notice a couple things:
1. the ratio of Rb87:Sr86 is on the x-axis, and the ratio of Sr87:Sr86 is on the y-axis.
2. Sample A is a hypothetical mineral which completely rejects Rubidium.
3. Because the Sr87:Sr86 ratio is the same in all the minerals (A through D), due to homogenization while in the lava state, the graph forms a flat line, with the x value representing the amount of Rubidium across the 4 minerals.
Ok, now suppose one Rubidium half –life from now (yes, I know the Rb half-life is billions of years; bear with me, I’m just trying to make the graph easy to produce and read) we re-measure minerals from the same rock sample. We get a new graph which looks like this:
This is what I want you to notice on this graph:
1. So now, hypothetically, we have both graphs. The initial quantities and the quantities one half life later
2. For every sample, the decrease (decay) in Rb87 is equal to the same increase in Sr87
3. The new graph still plots on a line, but now it has slope
4. Sample A and (delta)A are at the same point. Why? Since that sample had no Rb87 in it, there is nothing to decay into Sr87. One half-life later, there is still no Rb87, and since Sr87 has therefore not increased, the ratio Sr87:Sr86 remains the same.
Ok, so what does this mean? Well, let’s look at this next graph, which represents what the future scientists will see, if they had lost the data from our current measurements of the Hawaii flow. In other words, this is what the graph looks like to US when we date old rocks:
Can you see how we determine what the initial concentration of Sr87 was? Since sample (delta)A had no Rubidium in it to begin with, the Sr87 concentration never changed. In other words it is the same as the initial concentration.
Therefore, the y-intercept represents the initial concentration of Sr87.
Now lets look at a graph with real, measured data:
Figure 3: Rb-Sr isochron for the meteorite Juvinas. The points represent analyses on glass, tridymite and quartz, pyroxene, total rock, and plagioclase. After Faure (49). Data from Allegre and others (3).
From:How Old is the Earth: Radiometric Dating
Since we now know that the y-intercept represents the initial Sr87 concentration, we know that the initial ratio in this example was .69898 +/- .00005.
And THAT is why we NO LONGER assume the initial quantities. We don't even need them to be zero.
Last edited:
