Ozone depletion theroy of global warming

Radagast

comes and goes
Site Supporter
Dec 10, 2003
23,821
9,817
✟312,047.00
Country
Australia
Faith
Christian
Marital Status
Single
Upvote 0

Subduction Zone

Regular Member
Dec 17, 2012
32,628
12,068
✟230,461.00
Faith
Atheist
Marital Status
Single
Ratagast you miss the whole point. CFCs are a greenhouse gas, but the point is that CFC's destroy ozone greatly. One atom of CFC destroys 10,000 molecules of ozone. The ozone depletion theroy says that the ozone layer was so depleted by CFC that, that is the reason for the hole in the ozone layer discovered in 1983. Also the reason for the rapid rise of temperatures in the atmosphere in the ninties. When the hole in the atmosphere began to be replenished the temperature went down. That's also the reason for the pause in the temperature record from 1998 to 2014 when the temperature trend was slightly down,. before a volcano and the 2016 El Nino year.
Darn, my graph is broken again. This one forgot the supposed pause:

1200px-Global_Temperature_Anomaly.svg.png
 
  • Like
Reactions: Hans Blaster
Upvote 0

greatcloudlives

Active Member
Dec 28, 2019
347
39
63
Oregon City
✟26,155.00
Country
United States
Faith
Christian
Marital Status
Single
Yes.


The ozone hole does not cause heating; the theory is incorrect.

It's not the hole only which did cause warming in the southern hemisphere but the depletion caused suns heat to come through the thinner layer of ozone, whereas before ozone deflection was 100 percent.
 
Upvote 0

Subduction Zone

Regular Member
Dec 17, 2012
32,628
12,068
✟230,461.00
Faith
Atheist
Marital Status
Single
Ah a broken graph the satellite graph is not broken." Latest Global Temps Roy Spencer PHD."

Unfortunately that is a "broken" graph. The graph is very noisy and has not been properly smoothed:

UAH_LT_1979_thru_June_2020_v6.jpg


Thirteen months is far too short of a period of time when one is talking about climate change.
 
Upvote 0

greatcloudlives

Active Member
Dec 28, 2019
347
39
63
Oregon City
✟26,155.00
Country
United States
Faith
Christian
Marital Status
Single
Do you know what happens when you smooth a graph. ? You simply go from high point to high point and totally are misled by the graph and can't see what is going on. IMO it's very important that the temperature record dropped to zero above average in 2008 and 2012. This is not seen on the smoothed graph.
 
Upvote 0

Hans Blaster

Rocket surgeon
Mar 11, 2017
14,970
11,957
54
USA
✟300,271.00
Country
United States
Faith
Atheist
Marital Status
Private
Do you know what happens when you smooth a graph. ?

Yes, yes, I do understand. It's a technique I've used many times before and will use again.

You simply go from high point to high point and totally are misled by the graph and can't see what is going on.

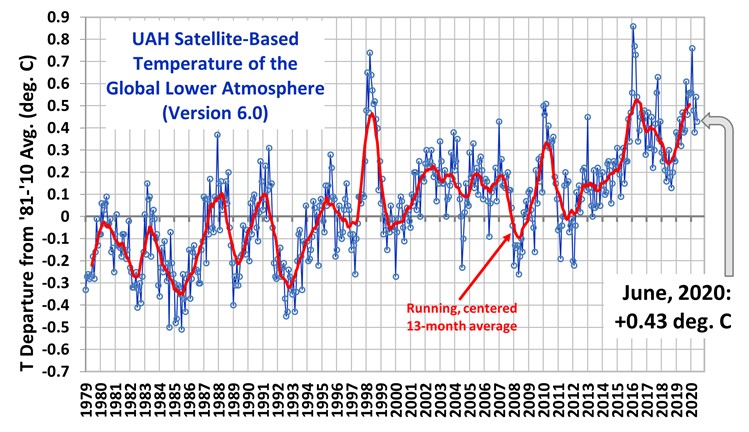
No, that's not what happens. As I recall from the last time we discussed this plot, the data is smoothed with a centered 13-point boxcar average. The data point plotted for example for July 2019 would average the values for that month with the 6 months prior and subsequent. Each month from January 2019 to January 2020 would be *equally* weighted in the average. Each value from Jan 2019 to Jan 2020 would be added together and then divided by the total number of values (in this case 13).

The 13-month moving average covers the full year, avoiding the unwanted signal from seasonal variation. It is centered, so it avoids a memory bias. The only disadvantage is that the opposite month (January) is included twice in the average (the previous and subsequent ones). A similar alternative would be a 11-month centered value that would avoid the double counting of the opposite month by omitting it completely. One alternative that might be to use a 12-point average, where the opposite month is included by averaging the prior and subsequent values, i.e., in this example Jan. 2019 and Jan. 2020 would be averaged together and then the result averaged with the 11 months inbetween.

It is a mathematical certainty that the average of a group of data points (no matter the weighting) can not be higher than the maximum in set nor smaller than the lowest in the set. It can only be equal to the maximum (or minimum) if all values are the same. Therefore, the average *cannot* just joint the peaks in the finely resolved data; that is impossible.

IMO it's very important that the temperature record dropped to zero above average in 2008 and 2012. This is not seen on the smoothed graph.

One month fluctuations are not relevant, only the long term trends. The data is smoothed by averaging to avoid getting lost in the short-term fluctuations of the base data set. [I should note that since the data is given as monthly values, that data is almost certainly averaged over all of the days within the month to get the monthly values.]
 
Upvote 0

Subduction Zone

Regular Member
Dec 17, 2012
32,628
12,068
✟230,461.00
Faith
Atheist
Marital Status
Single
Do you know what happens when you smooth a graph. ? You simply go from high point to high point and totally are misled by the graph and can't see what is going on. IMO it's very important that the temperature record dropped to zero above average in 2008 and 2012. This is not seen on the smoothed graph.
No, when one smooths a graph one gets rid of misleading highs and lows. That is why one needs to have an understanding of the amount of noise in one's data.
 
  • Agree
Reactions: Hans Blaster
Upvote 0
This site stays free and accessible to all because of donations from people like you.
Consider making a one-time or monthly donation. We appreciate your support!
- Dan Doughty and Team Christian Forums

greatcloudlives

Active Member
Dec 28, 2019
347
39
63
Oregon City
✟26,155.00
Country
United States
Faith
Christian
Marital Status
Single
The pause is very important to me and to the whole agw theroy. The pause is there on your smoothed graph a small flat between 2000 and 2015 this related information tells me that there may be another forcing factor. Or that CO2 is behaving with less sensitivity. Also Dr Roy Spencer's satellite graph is more accurate, as far as I know the temperature never became 1.0 C and is now .4 degrees C which is a big difference.

When did the anomaly become 1.0 Celcius ? As shown in the smoothed graph.
 
Upvote 0

greatcloudlives

Active Member
Dec 28, 2019
347
39
63
Oregon City
✟26,155.00
Country
United States
Faith
Christian
Marital Status
Single
World wide we are spending trillions of dollars to research and prevent a problem that is probably from cosmic Ray's or ozone depletion or the sun not co2. This money could be spent on cancer or heart disease or world hunger or potable water or poverty. It's a waste of time and money.
 
Upvote 0

Hans Blaster

Rocket surgeon
Mar 11, 2017
14,970
11,957
54
USA
✟300,271.00
Country
United States
Faith
Atheist
Marital Status
Private
World wide we are spending trillions of dollars to research and prevent a problem that is probably from cosmic Ray's or ozone depletion or the sun not co2. This money could be spent on cancer or heart disease or world hunger or potable water or poverty. It's a waste of time and money.

Do you work for the oil/coal/gas industry directly or indirectly?
 
Upvote 0

greatcloudlives

Active Member
Dec 28, 2019
347
39
63
Oregon City
✟26,155.00
Country
United States
Faith
Christian
Marital Status
Single
No, when one smooths a graph one gets rid of misleading highs and lows. That is why one needs to have an understanding of the amount of noise in one's data.

You also never see critical data unless it's constant through the whole year. So than no one will ever be able to tell if the trend is changing or not. I prefer to be in the know about all the information you need to tell if the climate is changing.
 
Upvote 0
This site stays free and accessible to all because of donations from people like you.
Consider making a one-time or monthly donation. We appreciate your support!
- Dan Doughty and Team Christian Forums

Hans Blaster

Rocket surgeon
Mar 11, 2017
14,970
11,957
54
USA
✟300,271.00
Country
United States
Faith
Atheist
Marital Status
Private
You also never see critical data unless it's constant through the whole year.

If by "critical" you mean "important or key" of course this is false. Data is released as it is. It isn't suppressed because some bit of it disagrees with some "dogma".

If you mean "contrary to a narrative" or "supporting non-CO2 explanations" then you're living in a paranoid delusion. Seek help. (And maybe just step away from all sources about climate.)

So than no one will ever be able to tell if the trend is changing or not.

Climate isn't a daily variation or weekly or monthly. Climate change isn't even the change year-to-year. It is a much longer trend (multiple years to decades). Monitoring climate data monthly is the equivalent of weighing yourself twice per hour to see if you're diet is working.

I prefer to be in the know about all the information you need to tell if the climate is changing.

The monthly satellite numbers aren't "all the information" even on this narrow measurement. Those numbers come from averaging the whole globe, so there is data from thousands of points on the globe. Likewise, it is not a single measurement (made for example at local noon on the 15th of the month), but itself a time-average of measurements made over the entire month at whatever the measurement frequency is.

You don't have the full satellite temperature measurement data set; you never have; you never will; and you can't handle the full data set. (It would probably overwhelm your home internet connection.)

But, the full set is available to those who can handle the processing of it. It's not hidden, it's just beyond the capabilities of most people, including you.
 
Upvote 0

Subduction Zone

Regular Member
Dec 17, 2012
32,628
12,068
✟230,461.00
Faith
Atheist
Marital Status
Single
You also never see critical data unless it's constant through the whole year. So than no one will ever be able to tell if the trend is changing or not. I prefer to be in the know about all the information you need to tell if the climate is changing.
See above.

By the way, extreme temperatures do not "prove" global warming. But the pattern of extreme temperatures is very strong evidence for AGW. One can always find individual events around the world that are the warmest ever recorded or the coldest ever recorded. But right now we find far more warmest event ever events than coldest ever. If there was no warming the numbers should be roughly equal. So keep that in mind when you read this article. For the first time ever a town north of the Arctic circle has hit 100 Fahrenheit:

Temperature hits 100 degrees Fahrenheit in Arctic Russian town
 
Upvote 0

greatcloudlives

Active Member
Dec 28, 2019
347
39
63
Oregon City
✟26,155.00
Country
United States
Faith
Christian
Marital Status
Single
So what the colder temps that show record cold temperatures have been going on for a while and this is when it becomes climate. The La Nina's are beginning to replace the El Nino years. The sunspot cycle is very low for 3 cycles ,23,24 and now the one we are in 25. The solor wind is decreasing allowing more cosmic Ray's which means more clouds in the sky. Combine all of that and you have a swing to cooling climate.
 
Upvote 0
This site stays free and accessible to all because of donations from people like you.
Consider making a one-time or monthly donation. We appreciate your support!
- Dan Doughty and Team Christian Forums

greatcloudlives

Active Member
Dec 28, 2019
347
39
63
Oregon City
✟26,155.00
Country
United States
Faith
Christian
Marital Status
Single
I understand that the CO2 climate theroy is an ethical biased notion. However that is no reason to fudge data and exaggerate the science. What about the waste of the Trillions of dollars which could be used for food and water to undeveloped countries. What about medical research for heart disease and cancer. No we are talking about a .8 degree Celsius divergence of the norm. Not worth spending Trillions on.
 
Upvote 0