You are using an out of date browser. It may not display this or other websites correctly.
You should upgrade or use an alternative browser.
You should upgrade or use an alternative browser.
Lack of CC disasters
- Thread starter Greatcloud
- Start date
It's sort of like blood work. When you go into the lab to get your blood tested, what they do is generate a baseline based on every 1000 people. That's what you see in the "normal" range. It is very inaccurate and that is one of the reasons why doctors are now treating patients with statins when they have 150 total cholesterol.
This analogy is flawed.
The baseline here is not 1000 people getting tested once to generate a population baseline.
The baseline here is for one person, tested 1000 times. Then the next time that one person gets tested, they see if their baseline is higher, lower or the same.
Then, they look at all the other baselines of all the other people that have been tested, and see if their test is higher, lower or the same. Then they compare all those tests to see the divergence from the baseline to work out the overall anomaly.
Again, its a relative meausre, not an absolute number.
Upvote
0
Thank you for your concern, however; in my opinion, the link provided and content of the post seems to imply a lack of knowledge and understanding as to how NASA Global Average Temperatures (GAT) are obtained and what they represent. Furthermore, as a retired scientist (Chemist & Process Engineer), of which part of my work included solar irradiation, weather and climate effects on specific polymers and organic & inorganic pigments, I do not appreciate referring to climate scientists as frauds and skewing data to get funding. If such a thing were actually true I would be very much on board for having such people prosecuted, fined and jailed.Do you realize they have stations in the desert?!?!? Do you understand how it skews the results????? https://earthobservatory.nasa.gov/Features/HottestSpot/
Those have very very high temperatures. This is not just 1 station, there are thousands and thousands. Those skew the data, the fraud $cientists try to be "subtle" about it...to push their agenda and also to get that $$$ funding.
Now, just a few brief bits of information and a few links that show how GAT's are actually obtained. NASA, in determining their GAT, divides the entire earths surface into a 80 equal area grids. That as well is divided into some 8,000 equal area grids. A very important aspect about GAT is that what it is based on is temperature anomalies (deg. C), not specific temperatures. For example, NASA uses the average period 1951-1980 as a baseline, understand that the definition of climate is a period of 30 years or longer, not to be confused with short term weather. So, using that base line for tens of thousands of stations individually, the anomaly is the temperature in deg. C above or below each stations baseline. So, as implied in your post about desert temperatures, it is not about how hot those deserts are, it is about the variation of the anomaly from the baseline. Along with that small grids are the average anomalies of stations, of which averages of larger grids are averaged anomalies of the smaller stations, which eventually arrives at a single GAT for the Earth. Keep in mind that this is not a single total average, small grids of equal size averaged, then those averages within a larger grid averaged and so on. Doing the averages that way is much more realistic than just averaging everything in a single lump. Please do not hesitate to ask questions.
Here are some links to the actual science and process.
https://pubs.giss.nasa.gov/docs/1987/1987_Hansen_ha00700d.pdf
https://data.giss.nasa.gov/gistemp/
https://data.giss.nasa.gov/gistemp/tabledata_v3/GLB.Ts+dSST.txt
Upvote
0
Go visit Australia's Great Barrier Reef, before it is lost completely - most of it is already dying; apparently the water is getting too warm for it and the increasing acidity also makes it harder to form the coral skeleton. There's a reason for that.
Upvote
0
lesliedellow
Member
- Sep 20, 2010
- 9,652
- 2,582
- Faith
- Calvinist
- Marital Status
- Single
- Politics
- UK-Liberal-Democrats
The data is all garbage.
And that is your considered opinion as a climate scientist, qualified in all the relevant fields.
Oh, and of course, another of your considered opinions is that the the Earth is flat. What more can we say?
Upvote
0
You don't seem to understand how readings are processed. Temperatures are compared to the history of readings from that location, to determine a temperature anomaly.Do you realize they have stations in the desert?!?!? Do you understand how it skews the results????? https://earthobservatory.nasa.gov/Features/HottestSpot/
Those have very very high temperatures. This is not just 1 station, there are thousands and thousands. Those skew the data, the fraud $cientists try to be "subtle" about it...to push their agenda and also to get that $$$ funding.
Upvote
0
Obliquinaut
Сделайте Америку прекрасной
- Jun 30, 2017
- 2,091
- 1,635
- 60
- Country
- United States
- Faith
- Atheist
- Marital Status
- Married
Do you realize they have stations in the desert?!?!? Do you understand how it skews the results????? https://earthobservatory.nasa.gov/Features/HottestSpot/
Those have very very high temperatures. This is not just 1 station, there are thousands and thousands. Those skew the data, the fraud $cientists try to be "subtle" about it...to push their agenda and also to get that $$$ funding.
Here's how it works: the temperature trends we are interested in is the TEMPERATURE ANOMALY. This is the difference between the temperature in a region and the same region's average over a reference period. This allows us, in the end to look at the TEMPERATURE DIFFERENCE with time.
So if there's a station in the desert it is telling you if that area is getting warmer. There are stations in cold areas as well. They are telling us if that area is getting warmer, irrespective of what the temperature is doing in the middle of the Sahara.
These temperature data are also grid-averaged over larger areas. The final result is a temperature TREND (how much warmer or cooler) overall.
Upvote
0
Obliquinaut
Сделайте Америку прекрасной
- Jun 30, 2017
- 2,091
- 1,635
- 60
- Country
- United States
- Faith
- Atheist
- Marital Status
- Married
What part of they combine all the averages do you not understand? When you do that, the stations in hotter parts are going to skew the results. What is so difficult to understand that???
That isn't how it works at all. Please read what others are telling you.
If you think 30 year baselines are "accurate", you are clueless. The 30 year itself could be an anomaly (same temperature range over 30 year anomaly etc).
I'm sorry to tell you this and I hope you don't take offense, but you are clearly the one who doesn't understand the topic at hand. Almost anyone who's actually read any of the actual science can see the flaw in your reasoning.
Do you not understand this? It is so basic.
It is relatively basic, but it is you who seems to fail to understand. Please look up information on TEMPERATURE ANOMALIES.
Upvote
0
eclipsenow
Scripture is God's word, Science is God's works
- Dec 17, 2010
- 8,293
- 1,735
- Country
- Australia
- Faith
- Anglican
- Marital Status
- Married
Sorry my hyperliteralistic Creationist Christian interlocutors, but evolution is true (as is every word of Genesis if you can bother to get the genre right, check Dr John Dickson's paper), and the old earth of climate change no reason to just reject climate change out of hand. The physics of CO2 are well know, and the effects modelled into global climate and weather projections are increasingly accurate and happening right now. The effects are serious, with the tropical heat zone expanding, and subtropical dry desert zones expanding further. Grain belts are going to die. The large grain belts of the world are going dustbowl.
And while today's TEA party right-wing Republican Christians just sneer, their children and grandchildren will shake their heads in shame and bewilderment at the heartless, politically driven armchair ignorance of their grandparents. The self-indulgent 'opinions' of this crowd will make their descendants wince.
Even The Pentagon admits that climate change is a threat multiplier. EG: Syria was a bunch of fuel and dynamite. Climate change was the spark.
Starting in 2006, Syria suffered its worst drought in 900 years; it ruined farms, forced as many as 1.5 million rural denizens to crowd into cities alongside Iraqi refugees and decimated the country’s livestock. Water became scarce and food expensive. The suffering and social chaos caused by the drought were important drivers of the initial unrest.
Climate scientists have argued that global warming very likely exacerbated the historic drought, thanks to potentially permanent changes to wind and rainfall patterns. Thus, even if negotiators do reach a resolution, the underlying strains in the region may be here to stay. In fact, almost half of the countries most at risk of water shortages in the coming decades are in the Middle East or North Africa.
The sad reality is that supply disruptions are increasingly likely at the same time as the world is facing rising demand for water. The toxic combination of population increases and water-intensive lifestyles, driven by affluence, may lead to devastating price spikes. Expect water wars in the decades ahead.
A major contributor to the Syrian conflict? Climate change
Upvote
0
gudz23
Active Member
The data is all garbage.
How does anyone measure the "temperature" of the world? What rubbish. Using land stations to collect data, there are huge gaps that are "assumed" and stations in tropical regions skew the results.
It is all rubbish. Nobody can predict the "temperature" or the "trend" of the world. If you don't believe me, look at how they measure it (some of the stations are in places where it reaches 134F)
Amazing then, that we can routinely report weather accurately on a global scale, considering that we according to you have no idea how to measure these things correctly. Not to mention the impossible task it is to store and compare more than a century's worth of collected data from all over the world. If only we had something called computer technology and a network of things...
But to address your problem. Data from from any given station is first and foremost compared with historic data from the same station. You can then figure out its current deviation from its historic norm. You can easily distinguish whether or not the deviation is more than just an annual anomaly. From the simple graph you get by doing this, you can easily see which way the trend is heading.
If you can do this one place, you can do this every place. When you find that the deviation is above average pretty much everywhere you look, you can safely assume that the whole planet is warming up.
Last edited:
Upvote
0
This site stays free and accessible to all because of donations from people like you.
Consider making a one-time or monthly donation. We appreciate your support!
- Dan Doughty and Team Christian Forums
juvenissun
... and God saw that it was good.
- Apr 5, 2007
- 25,446
- 803
- 71
- Country
- United States
- Faith
- Baptist
- Marital Status
- Married
CC is ONLY bad to those living on the coast.
I don't think so. Are you saying those people would have no risk from the sea if CC does not happen?
If those people are smart, the CC would even make them very rich.
Upvote
0
Kylie
Defeater of Illogic
There are no species having gone extinct due to CC disasters.
First Mammal Species Goes Extinct Due to Climate Change
15 animals facing extinction due to climate change
7 Species Hit Hard by Climate Change—Including One That's Already Extinct
Global warming linked to plant, animal extinctions | Climate Home - climate change news
More than 700 species facing extinction are being hit by climate change
The 10 species most at risk from climate change
And if you absolutely demand a scientific paper...
| Nature Climate Change
Now, would you care to revise your claim?
Upvote
0
TagliatelliMonster
Well-Known Member
Plants thrive in greenhouse-like conditions.
30% of crops of peas and several other vegetables in my country was lost due to the extreme warmth and drought the past 2 months.
It was a close call for certain other vegetables that had to be planted just last week in the fields. Drought was so severe in the weeks before it, that the field consisted of pure dry sand, almost like a beach - nothing could be planted there.
Thank goodness a big storm happened with quite some rain. A few days later and it would have been to late.
There are times in our earth's history when it was much warmer with much higher Co2 concentrations. It was lush and green! Plants and animals were growing faster.
The world is very different today.
Upvote
0
TagliatelliMonster
Well-Known Member
Crops are up and down all the time. Anything can happen in the agriculture industry.
Upvote
0
TagliatelliMonster
Well-Known Member
Didn't you learn in school wat the concept of "average" means?The data is all garbage.
How does anyone measure the "temperature" of the world? What rubbish. Using land stations to collect data, there are huge gaps that are "assumed" and stations in tropical regions skew the results.
It is all rubbish. Nobody can predict the "temperature" or the "trend" of the world. If you don't believe me, look at how they measure it (some of the stations are in places where it reaches 134F)
Upvote
0
This site stays free and accessible to all because of donations from people like you.
Consider making a one-time or monthly donation. We appreciate your support!
- Dan Doughty and Team Christian Forums
TagliatelliMonster
Well-Known Member
Do you realize they have stations in the desert?!?!? Do you understand how it skews the results?????
If the point of the exercise is to get an average global tempurature, then what would be skewing the results is NOT having stations there.
Those have very very high temperatures. This is not just 1 station, there are thousands and thousands
Yes. You see, when your goal is to obtain an average of something, then your obtained average will be more accurate as you feed MORE datapoints into it.
It's kind of sad that you need to have this explained to you...
Upvote
0
essentialsaltes
Stranger in a Strange Land
- Oct 17, 2011
- 33,160
- 36,482
- Country
- United States
- Faith
- Atheist
- Marital Status
- Legal Union (Other)
Upvote
0
- Apr 17, 2006
- 6,216
- 3,834
- 45
- Country
- Australia
- Faith
- Atheist
- Marital Status
- Single
- Politics
- AU-Greens
Fake News!Seen any bad ones recently?
Those cities were always flat and under water!
")
Upvote
0
essentialsaltes
Stranger in a Strange Land
- Oct 17, 2011
- 33,160
- 36,482
- Country
- United States
- Faith
- Atheist
- Marital Status
- Legal Union (Other)
(this is not intended as a rational argument. However, some people seem to be convinced by the most irrational things, so might as well give it a shot.)
Upvote
0
This site stays free and accessible to all because of donations from people like you.
Consider making a one-time or monthly donation. We appreciate your support!
- Dan Doughty and Team Christian Forums
Obliquinaut
Сделайте Америку прекрасной
- Jun 30, 2017
- 2,091
- 1,635
- 60
- Country
- United States
- Faith
- Atheist
- Marital Status
- Married
(this is not intended as a rational argument. However, some people seem to be convinced by the most irrational things, so might as well give it a shot.)
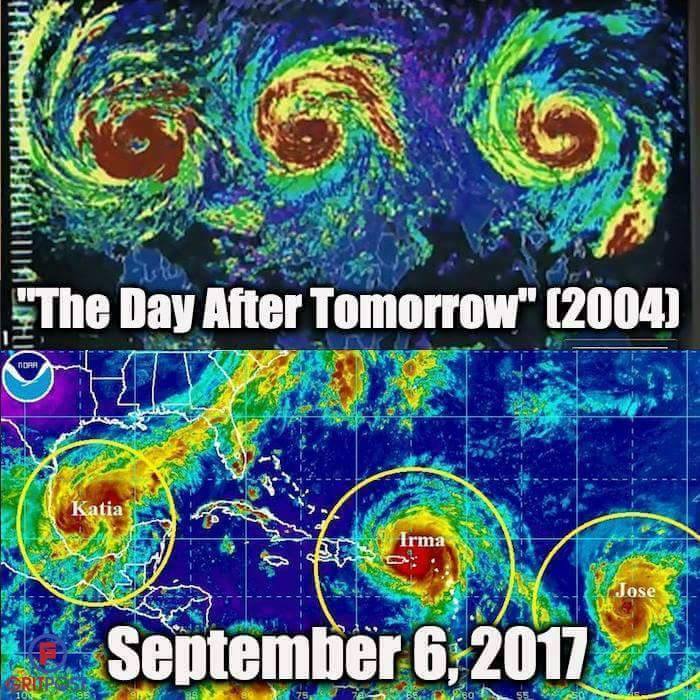
The Day after Tomorrow was truly disaster-inappropriate content, and just another awful movie, but it is kinda creepy that we are seeing exactly what one expects with increasing sea surface temperatures.
If only the scientists had an understanding of why the ocean surface temperatures are going up. Gosh.... We need more scientists like Dennis Quaid, whose mature echoes of 1980's hotness could calm our fevered brow with TROOOTH.
Nah....it's a mystery.
Until the helicopters fall out of the sky.
Upvote
0
Similar threads
- Replies
- 0
- Views
- 106
- Replies
- 3
- Views
- 172
- Replies
- 3
- Views
- 183
- Replies
- 0
- Views
- 141