1. So it's not the AntiChrist
Phew! For a minute there I thought you were going to use the scriptures to prove you had the right to write Scripture, and were a so-called 'prophet'.
")
At least you've given up the 'given in the spirit' routine, and so dropped the foundation for your "AC Plot" conspiracy theory. I'm glad that's out the way!
2. CO2 doesn't trap heat
I'm not a scientist, but even I know CO2 doesn't 'trap' heat in each molecule as such but redirects it back into the atmosphere.
I'm tired of being corrected over the popular layman's usage of the term, and so continue to use it. I say it 'traps' heat because that's the current English way we discuss it. I'll continue to use it in that sense, OK?
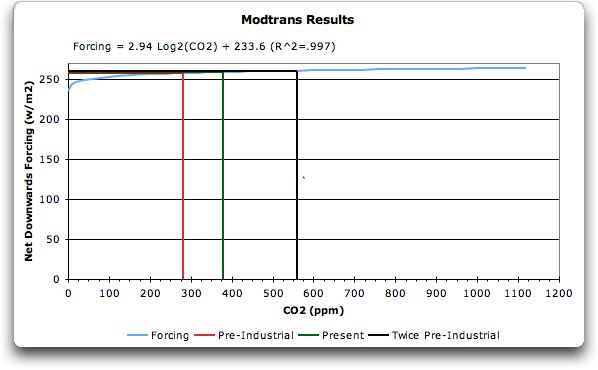
Also, the climatologists are all aware that CO2's impact is logarithmic. Suggesting otherwise is just ignorant of their case!
For a greenhouse gas, such as carbon dioxide, radiative transfer codes that examine each spectral line for atmospheric conditions can be used to calculate the change ΔF as a function of changing concentration. These calculations can often be simplified into an algebraic formulation that is specific to that gas.
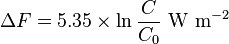
For instance, the simplified first-order approximation expression for carbon dioxide is:
where C is the CO2 concentration in parts per million by volume and C0 is the reference concentration.[6] The relationship between carbon dioxide and radiative forcing is logarithmic, and thus increased concentrations have a progressively smaller warming effect.
Radiative forcing - Wikipedia, the free encyclopedia
However, this is already accounted for in their modelling. They *know* this, and it is
dishonest to suggest otherwise! You're a Christian, aren't you? Why are you trying to deceive the readers here by suggesting that they might not know the logarithmic decrease of CO2's power? the extra units of CO2 only *really* start to decrease in effect long after we've cooked the planet.
To put it in other words, while the CO2 is growing exponentially, the temperature is only going up linearly.
For every doubling of CO2, the temperature only goes up x units: the temperature doesn't DOUBLE. The slow logarithmic decrease is already built into the math. Why are you pretending otherwise?
How do we know more CO2 is causing warming?
Temperature Response to CO2
Monckton claims that an exponential increase in atmospheric CO2 concentration would result in a linear increase in global temperature. But of course that depends on what the exponent is in the exponential increase. Monckton is referring to the logarithmic relationship between radiative forcing (which is directly proportional to the change in surface temperature at equilibrium) and the atmospheric CO2 increase. Note that we are not currently at equilibrium as there is a planetary energy imbalance, and thus further warming 'in the pipeline' from the carbon we've already emitted. Therefore, estimates of the rate of warming due to CO2 thus far will will be underestimates, unless accounting for this 'warming in the pipeline' (which Monckton does not).
This logarithmic relationship means that each doubling of atmospheric CO2 will cause the same amount of warming at the Earth's surface. Thus if it takes as long to increase atmospheric CO2 from 560 to 1120 ppmv as it did to rise from 280 to 560 ppmv, for example, then the associated warming at the Earth's surface will be roughly linear. So the question then becomes, how fast do we expect atmospheric CO2 to rise over the next century?
Monckton Myth #3: Linear Warming
3. You're way out on plants.
Yes there are some vegetables that enjoy extra Co2. But there are many important crops or animal feedstocks that do not!
Just saying Co2 = plant food, therefore more plant food will be good for them and force them to grow bigger is about as sensible as saying Pizza is human food, therefore more Pizza will be good for them and FORCE them to grow bigger!
We might in truth get bigger. But the trite summary above ignores diabetes, heart disease, circulatory problems and ... death. Plants are also vulnerable to various problems if they get too much 'plant food'. It messes with their self-defence toxins. Some produce too little; others too much.
Less toxic makes them more vulnerable to bug attacks.
The CO2 is Good for Plants Crock. Turns out not so much. | Climate Denial Crock of the Week
More toxic renders them inedible to us or livestock.
How plants respond to increasing carbon dioxide - The Science Show - ABC Radio National (Australian Broadcasting Corporation)
Also, let's not forget the carbon impacts on atmospheric temperatures and increased moisture movement. Every extra degree of temperature allows the atmosphere to carry 5% more moisture. That means increased evaporation and drought in drying areas, and increased precipitation in dumping areas. It means increased floods and famines.
4. The Earth's temperature is warming.
Of the top 3 climate monitoring units on the planet only Hadley says 1998 was the warmest, and the European Centre for Medium-Range Weather Forecasts (ECMWF) has pointed to a cooling bias with the Hadley data.
What has global warming done since 1998?
Two of the three most powerful temperature databases on the planet confirm 1998 as the THIRD warmest year on record, even when 1998 had one of the most frighteningly powerful El Nino's we've ever seen. Check it out [bless and do not curse]NOAA, NASA, then Hadley's CRU.
The NCDC at NOAA says:
///For 2010, the combined global land and ocean surface temperature tied with 2005 as the warmest such period on record, at 0.62°C (1.12°F) above the 20th century average of 13.9°C (57.0°F). 1998 is the third warmest year-to-date on record, at 0.60°C (1.08°F) above the 20th century average."
Global Analysis - Annual 2010 | State of the Climate | National Climatic Data Center (NCDC)
NASA GISTEMP confirms the same thing and says:
"Global surface temperatures in 2010 tied 2005 as the warmest on record, according to an analysis released Wednesday by researchers at NASA's Goddard Institute for Space Studies (GISS) in New York.///
http://www.giss.nasa.gov/research/news/20110112/
And now Phil Jones at the CRU, but don't forget the ECMWF has had a go at this particular dataset.
///The time series shows the combined global land and marine surface temperature record from 1850 to 2010. According to the method of calculation used by CRU, the year 2010 was the equal third (see footnote) warmest on record (with 2003), exceeded by 1998 and 2005. The years 2003, 2005 and 2010 are only distinguishable in the third decimal place. The error estimate for individual years (two standard errors is about ±0.1°C, see Brohan et al., 2006) is at least ten times larger than the differences between these three years.
The period 2001-2010 (0.44°C above 1961-90 mean) was 0.20°C warmer than the 1991-2000 decade (0.24°C above 1961-90 mean). The warmest year of the entire series has been 1998, with a temperature of 0.55°C above the 1961-90 mean. After 1998, the next nine warmest years in the series are all in the decade 2001-2010. During this decade, only 2008 is not in the ten warmest years. Even though 2008 was the coldest year of the 21st century it was still the 12th warmest year of the whole record.///
Information Sheet 1 redirection
But rather than argue over hundredths of a degree, which is all that seems to separate the temperatures, have a look at the 15 year trend *all* 3 agencies report. Brilliant graphic here.
Climate monitoring - Met Office
Even Denialist's are admitting it. At the 2009 Heartland Institute conference (of global warming sceptics), well known climate denialist Dr Patrick J Michaels (author of the World Climate Report Denialist blog) warned against using the 1998 El Nino super-spike as some sort of 'proof' of a cooling trend. Take the advice of the words of a fellow Denialist.
"You've all seen articles saying that global warming stopped in 1998. Well, with all due respect that's being a little bit unfair to the data. This is 1998 here, and it was a HUGE El Nino year, and the sun was very active in 1998, and so what you're going to have you're going to have a fall
as the consequent La Nina
takes place."
"Make an argument that you can get killed on and you will kill us all
If you loose credibility on this issue you lose this issue!"
1998 Revisited - YouTube
He then goes on to explain that when the El Nino cycles return, it's going to get really hot again. Not only that, but Patrick Michaels explains that:
"SO! Global warming IS REAL, and the second warming of the 20th Century, people have something to do with it! Now get over it!"
So while Denialists selectively zoom in on a few data points to try and skew the story any way they want, overall, the trend is clear.
Climate Denial Crock of the Week - Party like it's 1998 - YouTube
The last decade was the hottest on record, and anyone who says otherwise is denying the best data on the planet and pushing an anti-science agenda of their own.