Okay, this is a subject I have thought was quite interesting ever since I first learned of it. I had never really been one to think much about statistics or random vs. non-random prior to only a few years ago when I began to see the value in statistics. There has been some debate on this forum about evolution and randomness and I want to provide some visuals for this subject using some synthetic data I generated in excel using the RAND function.
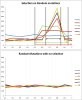
Description of what I did and how:
I generated a random set of numbers that range in value between 0 and 1, and I generated 2000 of them for each 'population'. There are 2 graphs shown, each with 6 'populations' of randomly generated numbers, but one with selection pressure and the other without. In the upper graph (the selection graph) the blue population (P1) represents the initial random 'population' that I started with. There are 3 phases of selection in the upper graph and these are represented by the color-coded arrows. The first selection pressure is positive for any number >0.5 and negative for any <0.5, selection 2 is positive for any number between 0.5 and 0.95, and the third pressure that is used for P4 through P6 is positive for any value between 0.65 and 0.85. After I "select" each population based on one of the 3 selection pressures, I regenerate the lost portion of the population using the RAND function again to get the population back up to 2000.
For the random graph, each population consists only of random numbers generated anew each time, with no selection of any kind.
What does this show?
There are obvious differences between each of the graphs, that much is obvious. What has been argued on this forum by select individuals in the past is that random mutations could not generate selection pressure that would drive macroevolutionary changes or the formation of new organs (like the eye). This argument comes from the lower graph where random mutations in the population (represented by the numbers 0 through 1) have no effect on the successive populations, that is to say that the random mutations in population 1 have no effect on population 2 etc etc. If selection were random then, there would be no selection for any given mutation or trait, but selection is not random. This is where the upper graph comes in. This time a random set of numbers (mutations) have been generated but I have added in a selection pressure. This means that there is some advantage to a given set of numbers (mutations) and disadvantages to others. Those that fall within a given range (one of the 3 selection pressures I applied) have an increased survival rate and are preferentially selected into the next population (they survive to mate), whereas those outside of this range do not continue on. These detrimental traits/mutations do not disappear wholly from the population because of the nature of genes (recessive, dominant, homozygous, heterozygous), and those that survive and reproduce will still produce offspring with these non-beneficial traits/mutations (the reason why I used the RAND function to boost the population back up to 2000 after each selection event). As you can see, selection pressures drive the population towards some average from P1 to P2 and then the average continues to change after each successive selection event.
What this shows is that those traits/mutations that are beneficial, become represented by a majority of the individuals in the population and those that are not, are on the fringes and at a disadvantage. So, let's apply this to the eye as an example. We start off with the random population, there are those with no traits for the eye (less than 0.5 in this case) and those with traits for the eye (>0.5). These early traits may be things like eyespots on simple eukaryotic cells. There are no nerves connecting these cells to any nervous system or brain, but they provide a different function than those around them, by detecting light. These eyespots are completely random in our population and with no selection pressure, the successive populations would look like graph 2. This may have very well been the case for some time, detecting light for a few billion years may have been unnecessary and conferred no benefit (meaning for a while it might have looked like graph 2). But then something changes, competition for resources escalates and those with eyespots have some advantage, enter selection pressure 1. After this initial selection pressure, the next population is made up of a larger portion of those with eyespots than those without. This continues to escalate into future generations so that those who are more efficient (the selection pressure where I narrow the range of acceptable values) at detecting light are at an advantage again.
Add into this equation millions and billions of years of selection just like this, and the eyespot becomes more efficient as transport of the signal is improved, the location is altered, then they become photosensitive cells, then they process more than just light or no light and can distinguish shapes, then images, then colors, then 3D, etc, etc.
Accumulation of these traits via random mutations with non-random selection pressure is easy to demonstrate. The beneficial mutation need only arise once. After that, selection acts upon it and selection is not random. As it progresses forward in time, efficiency improves and new selection pressures are added onto it. Selection for one trait may inadvertently benefit another trait (like selection for improved efficiency of the eye selects for traits that centralize the cells that process the information collected from the environment). This compounding effect means selection for the eyespot also selects for cells that will later become specialized as nerve cells and those that will later become brain cells. They don't arise all at once, and the ancestral forms of them would have been only slightly better than the ones before it, but better none the less.
It is a gradual process often separated by periods of punctuation. Gradual accumulation of beneficial traits and then some selection event that splinters the population and/or fragments it and reduces the size of the population which enhances the rate at which change occurs (see punctuated equilibrium). So, random processes that are acted upon by non-random processes can confer change over time.