YOu know people don't have to have a Ph. D to understand some of the issues. You really are a snob aren't you?
I DO know that. But then
I'm not the one who has:
1. Made his argument by merely telling us how high a position he's held in the oil business
2. Reminded everyone that he has a big paycheck
3. Flogged his credentials like a mule
4. Supported his statistics knowledge
not with robust statistical analyses of his actual individual points, but rather reminding everyone how many stats papers he has published (at least one of which that I am aware of has
nothing whatsoever to do with climatology...it's about eukaryote genetics.
Again, I
might be the lowest paid janitorial staff member at my employer for all you know.
At least I've shown my calculations and work. Alllll along the way.
So it doesn't matter if I have or don't have a PhD. It doesn't matter if I ever did work at a major east coast Oceanographic observatory measuring gas-ocean exchange, it doesn't matter if I currently work as an R&D scientist at a Fortune 100 company.
I'm as proud of what I've done in my life as the next guy. But that doesn't matter if I've made a math error.
But ironically enough in this thread you have yet to show me math errors
using mathematics.
Well I have spent much of this thread speaking with you, so I would say you do have a point there.
Clever! Gotta give you some points on that one.
Unfortunately
I'm the only one on here whose run any numbers more than merely graphing someone else's data.
Are you aware that many stats functions are available on Excel? I know you can't trust excel anymore because of how it fooled you into thinking 100 data points were the same as 30,000 data points, but if you get a new copy they have stats applications.
You can also download for free the R stats package.
But if you were really a lead statistics guru on your stats publication and the director of technology of something I suspect you already have plenty of access to SAS or JMP or even Minitab. Any of those.
You know the stats profs I have befriended over the years indicate that Minitab is what they like to use to teach stats to undergrads.
Ask yourself this. Which is easier: to go along with the crowd and have everyone love you, or go against the crowd and put up with the guff from the likes of you and your friends???
Here we go with more of the persecution complex.
I wouldn't put up with it if I didn't firmly believe what I say. As I said, I used to believe GW (Thistle thinks I doubt AGW because I am in oil. That isn't the case. I looked at the data and decided it didn't make sense.)
I've looked at the data and I think it makes sense.
So clearly I'm a "sheeple" and you are a brave individualist who sees the truth inerrantly.

(And when you are fooled into thinking that 100 data points looks like 30,000 data points it's Excel's fault. When the stats don't support you contention on the whole, it's math's fault. And when you can't get everyone to just listen to your anecdotal data it's
their fault. Got it.)
But you will believe what you want to believe--and your question shows that you think an argumentum ad populum is a valid argument and thus your illogic shows. An argumentum ad populum is the 'everyone knows blah blah blah" argument. It is the argument of sheeple, and it is a informal logical fallacy.
Uh, yeah, Mr. Oil Exec. I'm sure I'm far more willing to believe the
anecdotal data spouted by a bile-spewing school yard bully who
talks big but almost never shows anything to back that talk up versus the climatologists...whom I CAN READ FOR MYSELF.
Yup. That makes sense.
If I put out a theorem on general relativity, who here would understand it and be capable of judging it?
My but you certainly like to talk big. And when the pressure gets too high in the
discussion at hand you like to run off to tensor calculus and relativity!
It would be wasted just like the mathematically based but pictorially shown Morlet wavelet argument was.
I fully admit I don't understand Morlet waves. But then you can't apparently
teach anything about them or you could have done a great service. But instead you dropped it like a hot potato.
You
want everyone around you to be more ignorant than you. That's why you don't ever try to
inform at more than a gut-feeling level. You post a picture and run away. You obviously have people here who can handle the math if you explain it.
I don't make the assumption that everyone around me is inherently more stupid than me. That's why I show my work.
Of course I've spent years teaching so I know that people are capable of being taught.
But when I see someone "flash" a pretty picture and then run away from any indepth explanation I
know what that's all about.
that one went way over your head and you were reduced to saying the pictures were pretty.
If I recall the actual person who did the math and generated the picture that you merely regurgitated, himself said global warming wasn't happening. Which is in direct opposition to what
you have said.
So I fail to see how it was in support of you claim anyway.
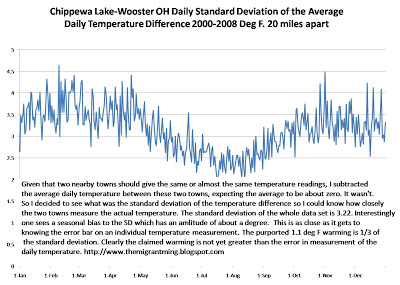
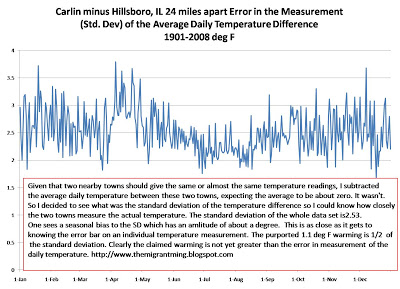
Why should I cast pearls before people who cant follow even a simple argument that if 8% of the stations have a 5 degree bias, that that means that the average is changed by .08 x 5 = 0.4 deg?
I cast my pearls out there
AND I SHOWED MY WORK AND THE RESULTS EXPLICITLY. And you said, if I recall that
I didn't see anything that made a bit of sense in that post.
So maybe you need to run some morlet wave calcs on it, because the algebraically based calcs seemed to have missed you. Maybe you could use some tensor calculus!
You have shown mostely irrelevant math. As my parable shows, if the measurements of the chair are perfectly gaussian, it doesn't ensure that the width of the chair has been measured correctly. My gosh I can't believe I am having to actually explain this to you over and over and over.
Well, if you actually
read my response you'll note I would clearly call into question the results since he somehow did such a horrible job of it, but I also wanted to make a point that even widely spread data can zero in on a rather narrow number.
If 100 measurements are "perfectly gaussian" I can make a rather narrow claim about the true value from that data.
(HINT: I was mostly having fun with that example. It was easy enough to do. Took about 5 minutes.)
As I said, you couldn't understand it. Shoot, you can't comprehend that if 8% of the stations have a 5 deg bias that the average is then biased by .4 deg.
Yet I
mathematically proved that two distributions of 100 samples each, one with 8% of the data biased high by several degrees cannot be statistically differentiated.
I guess it's the "math's fault" on that one too, isn't it?
(actually with more samples, like 1000 data points in each set, you
could differentiate it, it's part of how the t-test works! But do you have 1000 temperature measuring stations in a grid point?)
I have over and over told you where your error is.
Yet you don't ever type one single
mathematical formula.
I can show you how to add subscripts here on CF if that's your problem.
No, all I see from you is parables and proclamations and
anecdotal data.
You, like so many of your friends in "management" talk a lot.
And you clearly don't understand that a 5 deg bias in 8% of the stations is enough to cause half of the purported global warming.
You keep saying this, but I don't see any
proof of that other than a simple calculation of 0.08*5. Since this data is
averaged and gridded one would think you'd need to use some statistics or something to support the claim.
I showed my numbers, now you show yours.
science starts with observation. The observation may or may not be mathematical.
Look I tutor high school chemistry students now and
I guarantee you that the
second thing they are taught is an appreciation of their
error terms.
That's the way it works. Observations are nothing unless you appreciate fully how bad those observations are.
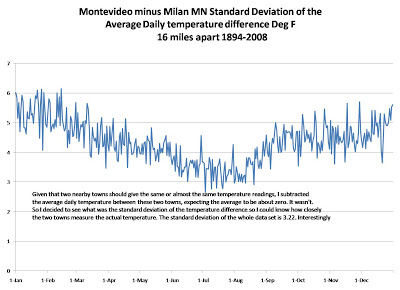
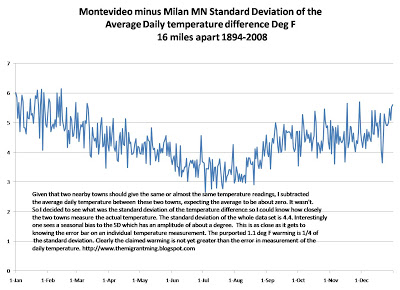
So far your side-by-side comparisons do little to impress me because:
1. I've shown them repeatedly to be within 2 degrees
at worst of each other on the median for 60-100 years worth of records
2. You are grabbing samples that are not necessarily truly random and don't necessarily represent an effective
sample of the overall system.
And before you say that they must use statistics to believe it, remember that there are lots of scientific observations that are one-offs.
yeah, and when there's data available that
isn't one off then to go through an randomly grab whatever pieces support
your contention doesn't mean you are doing science. It means you are selecting data rather than dealing with the data on the whole.
Measuring noise as signal.
I screwed that up. No doubt. I was in a hurry and didn't think about it. I freely acknowledge that. Acknowledging mistakes is also part of science--something that you seem to be incapable of.
And I'm
fine with that!But you are such an unrepentent bully that you pick on people mercilessly and you suddenly want everyone to pat you on the back and say "there there, little Glenny! It's alright!" And then you turn around and insult and spew more bile!
You are a massive hypocrite and a complete jerk 99% of the time. And you want
credit for the 1% you act like a regular human?
No, Glenn, it doesn't work that way. You insult my intelligence and abilities repeatedly you will be held accountable for every one of your errors.
I would gladly, and I mean
gladly let that go if you weren't such a massive tool most of the time.
No Thau, I think I said that I couldn't get Excel to do a big scatter gram. I haven't tried it again since I re-installed everything, but I never said it was excel's fault.
Let the court show the evidence, your honor:
Thau, I always will admit my errors and I screwed up the first plot. I admit it. Excel for some reason clips the number of points and I don't have a foggy clue as to why. But, I let that thing through so I will accept responsibility for it. It might take me a time or two to correct it but I always will.
*(emphasis added).
First off, you are the one who keeps bringing up the pay check.
I didn't bring it up in the first place, Glenn. That was
all you!
What did you take, freshman level physics for non-physics majors?
No, the first one was for majors. I only had to do two.
I didn't have time for more what with taking:
Organic chemistry
Organic geochemistry
Theoretical geochemistry
Quantitative analysis
Analytical Methods in Organic Chemistry
Chemistry symposium
Inorganic Chemistry
Physical chemistry
all along with my usual load of GEOLOGY classes because that was my major
and then I didn't have time in grad school what with doing a masters thesis on the organic geochemistry of kerogen and then a dissertation on the chemistry of macerals. (And taking a stats class too!)
Then even l had even less time after grad school as I was doing two
chemistry (not geochemistry, mind you) postdocs in carbon materials science (while teaching geology in the evenings). And then when I jumped over to industry to work as an R&D chemist for nearly the last decade I didn't have time to fill in with more physics classes. (Also teaching chemistry in the evenings.)
So what would I know about measuring things and dealing with data scientifically?
But again,
even if all this were me merely lying about my background, it wouldn't change one thing about the math I've shown. The numbers speak for themselves.
Want to take on the numbers? Then take on the numbers. Don't tell me about your paycheck or how many stats papers you've published. Just address the math.
(And do be afraid...because I don't think most people on here are as stupid as you may wish them to be.)