The latest study on covid deaths

Arc F1

Let the righteous man arise from slumber
Site Supporter
Mar 14, 2020
3,735
2,156
Kentucky
✟146,863.00
Country
United States
Faith
Christian
Marital Status
Married
John Hopkins University put out their take on all the covid deaths or I should say lack of deaths. I have to use an archived page because the original disappeared. This is very interesting. If this is true we deserve to know what's going on.

A closer look at U.S. deaths due to COVID-19

Another link.
A few days ago Johns Hopkins published a study saying corona is nbd. They then deleted it. Read it here in its entirety.

Update: see some of the posts below. They contain an update as to why the article was pulled.
 
Last edited:

Petros2015

Well-Known Member
Jun 23, 2016
5,097
4,328
52
undisclosed Bunker
✟289,851.00
Country
United States
Faith
Eastern Orthodox
Marital Status
Married
or I should say lack of deaths.

Couldn't get to the JHU archived link you posted yet, but I will try again and comment later

Here is the CDC though

Excess Deaths Associated with COVID-19

Graphically, this is the reported number of deaths in the united states week by week, from all causes (whether we got the cause right or not). The orange line is the 'threshold for excess deaths'. Crossing the orange line means 'something strange is happening and significantly more people are dying than expected'. (a slightly tougher than normal flu season for example, I think in 2018, guessing). You can see that in winter months we expect a normal increase in deaths nationwide every year.

upload_2020-11-27_9-7-56.png


My conclusion from this would be:

since about Feb 2020, 'something strange is happening and significantly more people are dying than expected'.

I call that 'something strange' Covid, but it's also societal response and impact to Covid -if there were 100 people who jumped off a building because they became unemployed during this time because Covid shut down their office, or they couldn't get medications they needed, they are on this graph too, and the cause of death was not viral, but rather the impact of virus (or the ground, as the case may be). But Covid is the direct or indirect cause of these deaths, no matter what is listed on the death certificate.

We have about one quarter million dead, listed as Covid, but I think you also have another 33% on top of that not listed, because they are recorded as heart attack or suicide or stroke, or 'found dead in apartment' correctly or incorrectly. But at any rate, they are ALL on the graph above.
 
Last edited:
  • Like
Reactions: Arc F1
Upvote 0

Arc F1

Let the righteous man arise from slumber
Site Supporter
Mar 14, 2020
3,735
2,156
Kentucky
✟146,863.00
Country
United States
Faith
Christian
Marital Status
Married
Couldn't get to the JHU archived link you posted yet, but I will try again and comment later

Here is the CDC though

Excess Deaths Associated with COVID-19

Graphically, this is the reported number of deaths in the united states week by week, from all causes (whether we got the cause right or not). The orange line is the 'threshold for excess deaths'. Crossing the orange line means 'something strange is happening and significantly more people are dying than expected'. (a slightly tougher than normal flu season for example, I think in 2018, guessing). You can see that in winter months we expect a normal increase in deaths nationwide every year.

View attachment 289543

My conclusion from this would be:

since about Feb 2020, 'something strange is happening and significantly more people are dying than expected'.

I call that 'something strange' Covid, but it's also societal response and impact to Covid -if there were 100 people who jumped off a building because they became unemployed during this time because Covid shut down their office, or they couldn't get medications they needed, they are on this graph too, and the cause of death was not viral, but rather the impact of virus (or the ground, as the case may be). But Covid is the direct or indirect cause of these deaths, no matter what is listed on the death certificate.

We have about one quarter million dead, listed as Covid, but I think you also have another 33% on top of that not listed, because they are recorded as heart attack or suicide or stroke, or 'found dead in apartment' correctly or incorrectly. But at any rate, they are ALL on the graph above.

They went all the way back to 2018 also and looked at the data. They found that there were no excess deaths. Covid just took away from heart disease, cancer etc.
 
  • Like
Reactions: chad kincham
Upvote 0

Arc F1

Let the righteous man arise from slumber
Site Supporter
Mar 14, 2020
3,735
2,156
Kentucky
✟146,863.00
Country
United States
Faith
Christian
Marital Status
Married
Couldn't get to the JHU archived link you posted yet, but I will try again and comment later

Here is the CDC though

Excess Deaths Associated with COVID-19

Graphically, this is the reported number of deaths in the united states week by week, from all causes (whether we got the cause right or not). The orange line is the 'threshold for excess deaths'. Crossing the orange line means 'something strange is happening and significantly more people are dying than expected'. (a slightly tougher than normal flu season for example, I think in 2018, guessing). You can see that in winter months we expect a normal increase in deaths nationwide every year.

View attachment 289543

My conclusion from this would be:

since about Feb 2020, 'something strange is happening and significantly more people are dying than expected'.

I call that 'something strange' Covid, but it's also societal response and impact to Covid -if there were 100 people who jumped off a building because they became unemployed during this time because Covid shut down their office, or they couldn't get medications they needed, they are on this graph too, and the cause of death was not viral, but rather the impact of virus (or the ground, as the case may be). But Covid is the direct or indirect cause of these deaths, no matter what is listed on the death certificate.

We have about one quarter million dead, listed as Covid, but I think you also have another 33% on top of that not listed, because they are recorded as heart attack or suicide or stroke, or 'found dead in apartment' correctly or incorrectly. But at any rate, they are ALL on the graph above.

I posted a new link
 
Upvote 0

Petros2015

Well-Known Member
Jun 23, 2016
5,097
4,328
52
undisclosed Bunker
✟289,851.00
Country
United States
Faith
Eastern Orthodox
Marital Status
Married
Thank you - after reading there are some good points and interesting data

I have a hard time though reconciling this:

upload_2020-11-27_11-5-45.png


with this

upload_2020-11-27_11-6-32.png


which does not look like the crude number of deaths from all causes is staying the same. I think we are going see it spike pretty high now above the orange post thanksgiving through December/Jan.

There are a couple of reasons an article can be pulled;

Site owners can pull it because it contains incorrect data and assumptions that they don't want people to see
Site owners can pull it because it contains correct data and assumptions that they don't want people to see
The author themselves can request a pull if they realize they made a mistake somewhere (I've done that myself a few times) or for further refinement to reflect challenges brought up during peer review with the intention of republishing

In this case, the author of the study was
Genevieve Briand | Johns Hopkins Advanced Academic Programs
(but we don't actually have the study? we just have an article about the study)

And the article that was pulled ABOUT the study was

upload_2020-11-27_11-23-19.png


by Yanni GU

John Hopkins University put out their take on all the covid deaths or I should say lack of deaths. I have to use an archived page because the original disappeared. This is very interesting. If this is true we deserve to know what's going on.

So here, what it looks like to me is that the student run newsletter published an article by a student Yanni Gu where they talked with Genevieve Briand Phd (economics professor) about data Ms Briand had complied and it's interpretations. Then, the editor of the student run newsletter decided to unpublish it. Could be for any variety of reasons - Editorial decision, maybe Ms. Briand felt she was misquoted or requested a pull or something more nefarious (Deep State has the boyfriend of the student newsletter editor tied up and has made it clear they don't want the Truth(tm) exposed)

Best way to know might be to contact Ms. Briand, Yanni Gu or the editor of the newsletter who would have made the pulling decision. But I'm not sure that retracting an article on a student newsletter qualifies as "John Hopkins University put out their take" on Covid deaths, and then decided it was too controversial for public consumption.

What (I suspect) happened was that the editor looked at the part that I highlighted which Yanni Gu would have written (their opinions about Briand's data/view) and said the same thing I said: "I can't reconcile what you've said with the actual situation." Possibly Briand said the same thing "what you've said is my view does not correctly capture my view" and then one or both of them decided to pull the article about Briand's data from the student newsletter.
 
Last edited:
Upvote 0

loveofourlord

Newbie
Feb 15, 2014
8,125
4,529
✟270,357.00
Faith
Christian
Marital Status
Private
Couldn't get to the JHU archived link you posted yet, but I will try again and comment later

Here is the CDC though

Excess Deaths Associated with COVID-19

Graphically, this is the reported number of deaths in the united states week by week, from all causes (whether we got the cause right or not). The orange line is the 'threshold for excess deaths'. Crossing the orange line means 'something strange is happening and significantly more people are dying than expected'. (a slightly tougher than normal flu season for example, I think in 2018, guessing). You can see that in winter months we expect a normal increase in deaths nationwide every year.

View attachment 289543

My conclusion from this would be:

since about Feb 2020, 'something strange is happening and significantly more people are dying than expected'.

I call that 'something strange' Covid, but it's also societal response and impact to Covid -if there were 100 people who jumped off a building because they became unemployed during this time because Covid shut down their office, or they couldn't get medications they needed, they are on this graph too, and the cause of death was not viral, but rather the impact of virus (or the ground, as the case may be). But Covid is the direct or indirect cause of these deaths, no matter what is listed on the death certificate.

We have about one quarter million dead, listed as Covid, but I think you also have another 33% on top of that not listed, because they are recorded as heart attack or suicide or stroke, or 'found dead in apartment' correctly or incorrectly. But at any rate, they are ALL on the graph above.

you don't get those levels just from people responding to covid, not to that level.

One question anyone able to tell what happened in 17? When I first read that graph I thought that was april's bump followed by the rest of the year being lower heh.
 
Upvote 0

miamited

Ted
Site Supporter
Oct 4, 2010
13,243
6,313
Seneca SC
✟705,807.00
Country
United States
Faith
Christian
Marital Status
Married
Hi all,

Probably should include overview of this link, along with the supplied OP's link: A closer look at U.S. deaths due to COVID-19

It would appear that the Johns-Hopkins staff have categorically denied that a lot of the facts and figures in the original story are accurate. While the researcher claims that there has been no appreciable increase in total number of deaths found in CDC data, it seems that there have actually been 300,000 more deaths than in a normal year per that same CDC data.

God bless,
ted
 
Upvote 0

miamited

Ted
Site Supporter
Oct 4, 2010
13,243
6,313
Seneca SC
✟705,807.00
Country
United States
Faith
Christian
Marital Status
Married
83ddb0f4-0b8a-4259-8bc0-8da2d0b2eab5.sized-1000x1000.png


I can say this about her first graph. While the graph itself shows movement in the total number of deaths in pretty much every age group from week to week, the numbering chart on the side seems to make the claim that exactly 530 young people 14 and under died each of the 32 weeks in question. That, I'm sure, is a statistical impossibility.

So, it would seem that the Johns-Hopkins staff is correct, that this person, not being at all well versed with medical statistics, has not properly digested and presented the information. So, for the OP who thinks that 'if' these facts are true, then they should be looked into. It appears that they have been.

God bless,
ted
 
Upvote 0

FreeinChrist

CF Advisory team
Christian Forums Staff
Site Advisor
Site Supporter
Jul 2, 2003
145,030
17,405
USA
✟1,750,453.00
Country
United States
Faith
Baptist
Marital Status
Married
Politics
US-Democrat
The current version (A closer look at U.S. deaths due to COVID-19) starts with a disclaimer.

JHU NewsLetter said:
Editor’s Note: After The News-Letter published this article on Nov. 22, it was brought to our attention that our coverage of Genevieve Briand’s presentation “COVID-19 Deaths: A Look at U.S. Data” has been used to support dangerous inaccuracies that minimize the impact of the pandemic.

We decided on Nov. 26 to retract this article to stop the spread of misinformation, as we explained on social media. However, it is our responsibility as journalists to provide a historical record. We have chosen to take down the article from our website, but it is available here as a PDF.

In accordance with our standards for transparency, we are sharing with our readers how we came to this decision. The News-Letter is an editorially and financially independent, student-run publication. Our articles and content are not endorsed by the University or the School of Medicine, and our decision to retract this article was made independently.

Briand’s study should not be used exclusively in understanding the impact of COVID-19, but should be taken in context with the countless other data published by Hopkins, the World Health Organization and the Centers for Disease Control and Prevention (CDC).​
 
  • Informative
Reactions: Arc F1
Upvote 0
This site stays free and accessible to all because of donations from people like you.
Consider making a one-time or monthly donation. We appreciate your support!
- Dan Doughty and Team Christian Forums

Arc F1

Let the righteous man arise from slumber
Site Supporter
Mar 14, 2020
3,735
2,156
Kentucky
✟146,863.00
Country
United States
Faith
Christian
Marital Status
Married
Thank you - after reading there are some good points and interesting data

I have a hard time though reconciling this:

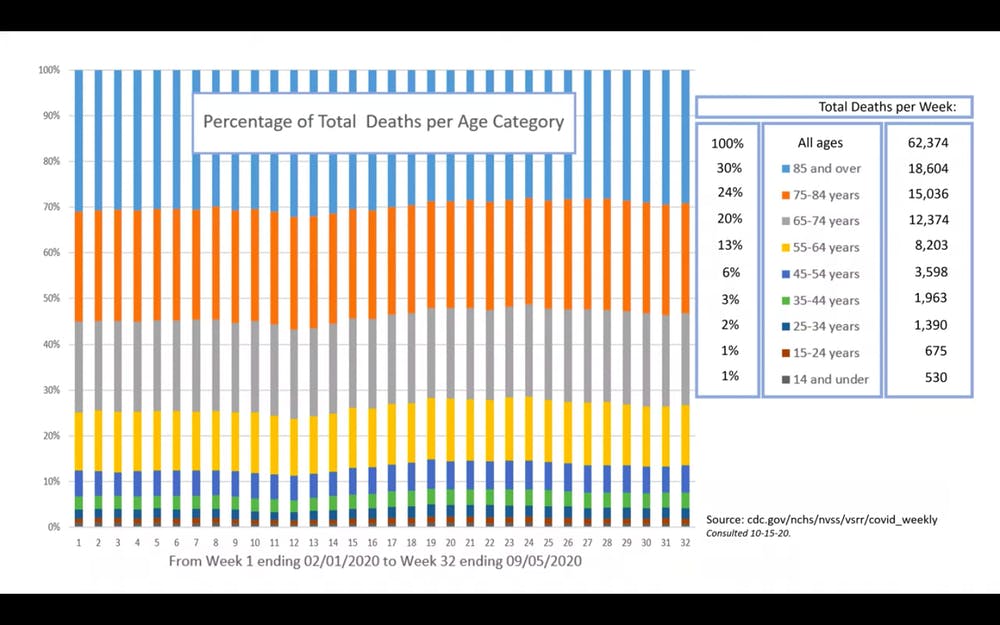
View attachment 289552

with this

View attachment 289553

which does not look like the crude number of deaths from all causes is staying the same. I think we are going see it spike pretty high now above the orange post thanksgiving through December/Jan.

There are a couple of reasons an article can be pulled;

Site owners can pull it because it contains incorrect data and assumptions that they don't want people to see
Site owners can pull it because it contains correct data and assumptions that they don't want people to see
The author themselves can request a pull if they realize they made a mistake somewhere (I've done that myself a few times) or for further refinement to reflect challenges brought up during peer review with the intention of republishing

In this case, the author of the study was
Genevieve Briand | Johns Hopkins Advanced Academic Programs
(but we don't actually have the study? we just have an article about the study)

And the article that was pulled ABOUT the study was

View attachment 289555


by Yanni GU


So here, what it looks like to me is that the student run newsletter published an article by a student Yanni Gu where they talked with Genevieve Briand Phd (economics professor) about data Ms Briand had complied and it's interpretations. Then, the editor of the student run newsletter decided to unpublish it. Could be for any variety of reasons - Editorial decision, maybe Ms. Briand felt she was misquoted or requested a pull or something more nefarious (Deep State has the boyfriend of the student newsletter editor tied up and has made it clear they don't want the Truth(tm) exposed)

Best way to know might be to contact Ms. Briand, Yanni Gu or the editor of the newsletter who would have made the pulling decision. But I'm not sure that retracting an article on a student newsletter qualifies as "John Hopkins University put out their take" on Covid deaths, and then decided it was too controversial for public consumption.

What (I suspect) happened was that the editor looked at the part that I highlighted which Yanni Gu would have written (their opinions about Briand's data/view) and said the same thing I said: "I can't reconcile what you've said with the actual situation." Possibly Briand said the same thing "what you've said is my view does not correctly capture my view" and then one or both of them decided to pull the article about Briand's data from the student newsletter.

So far they haven't put out a statement. If you remember the cdc did the same a while back and that article disappeared also. Every time someone comes out with data against what we are seeing the information gets deleted. They get banned from social media and their data disappeared. Before we even get to ask questions or investigate the data poof it's gone. I see a lot of effort going into controlling the narrative and for what reason? What is the end goal?
 
Upvote 0

Arc F1

Let the righteous man arise from slumber
Site Supporter
Mar 14, 2020
3,735
2,156
Kentucky
✟146,863.00
Country
United States
Faith
Christian
Marital Status
Married
Hi all,

Probably should include overview of this link, along with the supplied OP's link: A closer look at U.S. deaths due to COVID-19

It would appear that the Johns-Hopkins staff have categorically denied that a lot of the facts and figures in the original story are accurate. While the researcher claims that there has been no appreciable increase in total number of deaths found in CDC data, it seems that there have actually been 300,000 more deaths than in a normal year per that same CDC data.

God bless,
ted

Idk. Seems like we are being taught to believe what we are told not what we see. There's so much information out there it's hard to see the truth.
 
Upvote 0

Arc F1

Let the righteous man arise from slumber
Site Supporter
Mar 14, 2020
3,735
2,156
Kentucky
✟146,863.00
Country
United States
Faith
Christian
Marital Status
Married
The current version (A closer look at U.S. deaths due to COVID-19) starts with a disclaimer.

JHU NewsLetter said:
Editor’s Note: After The News-Letter published this article on Nov. 22, it was brought to our attention that our coverage of Genevieve Briand’s presentation “COVID-19 Deaths: A Look at U.S. Data” has been used to support dangerous inaccuracies that minimize the impact of the pandemic.

We decided on Nov. 26 to retract this article to stop the spread of misinformation, as we explained on social media. However, it is our responsibility as journalists to provide a historical record. We have chosen to take down the article from our website, but it is available here as a PDF.

In accordance with our standards for transparency, we are sharing with our readers how we came to this decision. The News-Letter is an editorially and financially independent, student-run publication. Our articles and content are not endorsed by the University or the School of Medicine, and our decision to retract this article was made independently.

Briand’s study should not be used exclusively in understanding the impact of COVID-19, but should be taken in context with the countless other data published by Hopkins, the World Health Organization and the Centers for Disease Control and Prevention (CDC).​

Looking at the raw data we are well below the average yearly death rate. If I'm correct I see "excess deaths" as being anyone who died of covid not excess deaths total. The university calls this disinformation yet everything was true. Heart disease has gone down along with cancer and everything else. How can that be?

BTW, I only got one notification and that was the first comment. I didn't even know anyone else said anything until I came back to the article. I'm using Android.
 
Upvote 0

miamited

Ted
Site Supporter
Oct 4, 2010
13,243
6,313
Seneca SC
✟705,807.00
Country
United States
Faith
Christian
Marital Status
Married
Idk. Seems like we are being taught to believe what we are told not what we see. There's so much information out there it's hard to see the truth.

Hi arc,

Well, I'd respectfully say that if you can't see it (the truth concerning this particular issue) then you just aren't looking. It is really quite impossible for me to even fathom 'how' anyone could be powerful enough to get every nation and most every medical professional and then pretty much every journalist that's reporting on the pandemic, to sustain some lie that supports some hidden agenda in all of this.

I mean, maybe if this pandemic and the reports of widespread infection and subsequent death totals, were limited to just the U.S. one might have a way to argue that some U.S. person of power is pulling some strings to have pretty much everyone in the country lying to us about the numbers. But, come on, the world over? This person or 'cabal' is powerful enough to get Great Britain in on it? France? Australia? Even Brazil says they've logged over 175,000 deaths. India says they have suffered 135,000 deaths. All of this is some lie perpetrated and carried on by some powerful political cabal? I'm sorry, but to me, that's about as conspiratorial as the claim that some make that the U.S. government was behind the 9/11 attacks or the shooting deaths at so many of our schools. That the holocaust didn't happen! We've never landed on the moon!

If your eyes are unwilling or unable to see this pandemic for the event that it really is worldwide, then I suggest that you should open them. This idea that it's not really as serious as it is, is simply lunacy as far as I'm concerned. And that's a studied and measured response based on quite a lot of supporting evidence. Unlike the current 'fraud in the election' tale that's being spoon fed through the cabal of Trump's administration and supporters, the reality of the Covid crisis and resultant deaths is well grounded in verifiable facts and evidence.

This is one of the dangerous outflows of our leaders attempt to make us believe that competent and long standing journalistic sources are pushing 'fake news'. It just isn't true, as are the great, great majority of his claims, but it causes people unwilling to really research and seek the truth, to lose faith in our competent and long standing news sources. That will be a very dangerous phenomenon for our nation, or any nation, to deal with. If we just turn away from truth because it may not agree with what we believe? We're going to be in pretty serious trouble.

Now, so far there is only a minority of our nation that falls for all this glitz and glimmer fairy tale reality, but it does seem to be gaining ground. And the idea being pushed by our leadership makes it much more easy for the gullible to accept it.

Come on! Do the research! Don't just pick out one or two or a small sample of articles that agree with your understanding. Look over the broad breadth of coverage and weigh and investigate the claims made by each one. Just as in this case. A claim is being made that our death count isn't any higher than it normally is. Is that a true statement? Find out!!

I think the first tell-tale sign would be that the very institution of which this researcher is a student, denies the veracity of the study and it's findings. Further, while one might be swayed by the argument that the report was taken off the net shortly after it was put up, it is back and fully available to anyone who wants to read it. So, this idea that some cabal is hiding the truth from us, really doesn't wash in this instance.

God bless,
ted
 
  • Winner
Reactions: Benam
Upvote 0

Arc F1

Let the righteous man arise from slumber
Site Supporter
Mar 14, 2020
3,735
2,156
Kentucky
✟146,863.00
Country
United States
Faith
Christian
Marital Status
Married
Hi all,

Probably should include overview of this link, along with the supplied OP's link: A closer look at U.S. deaths due to COVID-19

It would appear that the Johns-Hopkins staff have categorically denied that a lot of the facts and figures in the original story are accurate. While the researcher claims that there has been no appreciable increase in total number of deaths found in CDC data, it seems that there have actually been 300,000 more deaths than in a normal year per that same CDC data.

God bless,
ted

I looked at the cdc raw data and it looks like we are below the average for the past years. It also seems heart disease, cancer etc. has gone down for the year. I'm just looking, I have a habit of questioning everything.
 
Upvote 0
This site stays free and accessible to all because of donations from people like you.
Consider making a one-time or monthly donation. We appreciate your support!
- Dan Doughty and Team Christian Forums

miamited

Ted
Site Supporter
Oct 4, 2010
13,243
6,313
Seneca SC
✟705,807.00
Country
United States
Faith
Christian
Marital Status
Married
Hi arc,

You wrote:
Looking at the raw data we are well below the average yearly death rate.

Yes, but your looking at raw data that has been called into question. Why don't you see if that raw data is correct. I'm pretty sure that you're going to find out that we are not, in fact, 'well below the average yearly death rate'. Not here and not in many, many nations.

God bless,
ted
 
Upvote 0

Arc F1

Let the righteous man arise from slumber
Site Supporter
Mar 14, 2020
3,735
2,156
Kentucky
✟146,863.00
Country
United States
Faith
Christian
Marital Status
Married
Hi arc,

You wrote:


Yes, but your looking at raw data that has been called into question. Why don't you see if that raw data is correct. I'm pretty sure that you're going to find out that we are not, in fact, 'well below the average yearly death rate'. Not here and not in many, many nations.

God bless,
ted

I am looking. Should I not question? Come on now surely you don't believe everything that your told. I haven't made any definitive statements just looking for truth. All I tend to hear though is shut up and get in line instead. The one thing I never see is look at this information that I've already run across.

The raw data is a good start. If less people are going to die this year there has to be a reason. Calling covid excess deaths is misleading. People tend to think we are going to have more deaths than average. If heart disease and cancer deaths are going down we need to know why so we can continue on that path.
 
Upvote 0

miamited

Ted
Site Supporter
Oct 4, 2010
13,243
6,313
Seneca SC
✟705,807.00
Country
United States
Faith
Christian
Marital Status
Married
I looked at the cdc raw data and it looks like we are below the average for the past years. It also seems heart disease, cancer etc. has gone down for the year. I'm just looking, I have a habit of questioning everything.

Hi arc,

Would you provide for everyone that link? Because I pulled up a CDC link that shows pretty solid overages in that metric. I was unable to copy the graph, but you will find it about a third of the way down this link: Excess Deaths Associated with COVID-19 Beginning just prior to April of 2020 the graph shows a sizable increase in the week by week numbers of deaths. This continues to the end of the graph. That means that from about the end of March (the graph is labeled in 3 month sets) until about November each and every week we have had an increase in the total number of deaths over what is the mean average of the last few years for those specific weeks.

So, I don't know where you got your CDC data, but I'd be interested to know that the CDC itself isn't aware that it's putting out conflicting data.

God bless,
ted
 
Upvote 0
This site stays free and accessible to all because of donations from people like you.
Consider making a one-time or monthly donation. We appreciate your support!
- Dan Doughty and Team Christian Forums

Arc F1

Let the righteous man arise from slumber
Site Supporter
Mar 14, 2020
3,735
2,156
Kentucky
✟146,863.00
Country
United States
Faith
Christian
Marital Status
Married
Hi arc,

Would you provide for everyone that link? Because I pulled up a CDC link that shows pretty solid overages in that metric. I was unable to copy the graph, but you will find it about a third of the way down this link: Excess Deaths Associated with COVID-19 Beginning just prior to April of 2020 the graph shows a sizable increase in the week by week numbers of deaths. This continues to the end of the graph. That means that from about the end of March (the graph is labeled in 3 month sets) until about November each and every week we have had an increase in the total number of deaths over what is the mean average of the last few years for those specific weeks.

So, I don't know where you got your CDC data, but I'd be interested to know that the CDC itself isn't aware that it's putting out conflicting data.

God bless,
ted

I will go back and look for it. That's one of the problems with deleting data from view. I can sit here and say I saw something and tomorrow it's gone. I don't know if that's the case in this situation but I've run across that issue several times. Or that the search engines won't list results for certain things anymore. Manipulation is easy in the digital age. I'll get back to you soon as I can.
 
Upvote 0